Association of Glucometric Variability with Clinical and Economic Outcomes in a Community Hospital Setting
*Corresponding Author(s):
James A KoziolDepartment Of Molecular And Experimental Medicine, The Scripps Research Institute, La Jolla, San Diego, California, United States
Tel:+1 8587842704,
Email:koziol@scripps.edu
Abstract
Aim
We recently introduced excursions of blood glucose levels outside the normal range (70 mg/dL to 180 mg/dL) as a measure of glucose control in inpatient settings. We here investigate the clinical utility of this metric, and hypothesize that inpatients experiencing excursions incur increased lengths of stay and total costs compared to patients under successful glucose control.
Methods
Glucometric data were collected from 2023 inpatients from a San Diego hospital between 2009 and 2011. APRDRG codes were consolidated into 11 entry classes and combined with severity illness codes for subsequent analyses. General linear models for length of stay and total costs were devised, based on patient demographic and clinical characteristics as well as occurrences of excursions >180 or <70 mg/dL or both.
Results
Demographic and clinical characteristics of the study cohort have been reported previously. Median Length of Stay (LOS) was 5.0 days (range 1.1 to 139.4 days, interquartile range 5.6 days); median total cost was $15.7K (range $2.7K to $508.4K, IQ range $19.7K). LOS was not significantly related to gender (F1,2000=0.85, p=0.36) or ethnicity (F3,2000=0.86, p=0.46), but was significantly dependent on entry class (F10,2000=29.57, p<10-12), severity (F3,2000=219.14, p<10-12), age (F2,2000=6.60, p=0.0014) and occurrence of excursions (F3,2000=31.68, p<10-12). Similarly, total costs were not significantly related to gender (F1,2000=0.003, p=0.96) or ethnicity (F3,2000=2.28, p=0.08), but was significantly dependent on entry class (F10,2000=44.68, p<10-12), severity (F3,2000=272.38, p<10-12), age (F2,2000=17.32, p<10-7) and occurrence of excursions (F3,2000=22.30, p<10-12).
Conclusion
After adjusting for entry class, severity of illness, and age, patients exhibiting maximal glucose variability incur longer lengths of stay and higher total costs than other patients.
Keywords
ABBREVIATIONS
APR-DRGs - All Patient Refined Diagnosis Related Groups
EMR - Electronic Medical Record
POC - Point of Care
LOS - Length of Stay
INTRODUCTION
The diabetes population is expected to at least double in the next 25 years and the cost of treating the disease will nearly triple, as hospitalizations associated with diabetes continue to rise [1,2]. Hyperglycemia in the hospital environment is associated with higher rates of complications, longer lengths of stay and higher mortality rates [3-12]. Improved glucose management has been demonstrated to reduce length of stay and improve morbidity and mortality outcomes [13-18]. In the current environment of increased reporting of quality outcomes, it remains critically important for health care systems to have the capacity to monitor glucose management and to set appropriate targets to minimize complications and costs. Healthcare systems across the nation face serious challenges when managing blood glucose levels in high-risk, hospitalized patients and often this care is suboptimal [19-21]. Although standardized, evidence-based protocols and team management models have the potential to improve care delivery and quality outcomes in glucose management, there never the less remain formidable barriers to the system-wide implementation of these approaches. Moreover, a standardized metric is needed to assess and compare the efficacy and safety of these glucose management interventions.
The Society for Hospital Medicine provides guidelines for tracking glucose control in the hospital environment, but these have not been adopted consistently across health systems [22,23]. The most commonly used metrics include a day- or stay-weighted mean of glucose values using Point of Care (POC) measurements [24]. These averages provide summaries of glucose control, but may fail to fully capture important aspects of individual patient experiences, such as hyper- or hypoglycemic events and/or glucose variability. Indeed, glucose variability has been linked with mortality and thus has been proposed as an important indicator of blood glucose management [25].
In a previous paper [26], we introduced a simple metric of glucose variability in the hospital setting, namely, glucose excursions. We examined this metric using data from a two year observational study of glucose management in a San Diego community hospital, focusing on the initial validation of this new glucometric monitoring method. In this paper, we consider the issue of whether there is any association between our proposed metric and clinical and economic outcomes; in other words, what is the clinical merit or utility of our metric? At the outset, our working hypothesis is that inpatients experiencing excursions incur increased lengths of stay and total costs compared to patients under successful glucose control.
METHODS
Participants and setting
Data collection
Measures
Lengths of hospitalizations per patient were calculated as the difference between each patient’s discharge and admission times, as recorded in the electronic data warehouse. In this regard, we removed one subject from the patient cohort in [26], to ensure that all patients in this study cohort had been hospitalized for at least 1 day. Hospitalization costs are distinct from charges and were determined using nationally representative payment rates for 2010 based on diagnostic related groups, available through the Centers for Medicare and Medicaid Services.
Descriptive and predictor variables
Statistical analyses
For purposes of analysis, we categorized ages roughly into terciles with cutpoints at 65 and 80 years. We also classified all patients into 4 subgroups on the basis of their excursion history: no excursions, excursions solely to glucose levels >180 mg/dL; excursions solely to glucose levels < 70 mg/dL, and excursions both to levels >180 mg/dL and <70 mg/dL. We used general linear models to model lengths of stay and total costs from the potential predictors gender, ethnicity, age, entry class, severity of illness, and excursions. We chose not to use BMI in our formal analyses, because of the large amount of missing data relating to BMI. The potential predictors were all categorical, as depicted in Table 1. Our two outcome variables of interest, lengths of stay and total costs, are both non-negative, but with distributions that are noticeably skewed and kurtotic; we therefore used log transformations [27,28] prior to model fitting. we prepared normal probability plots to depict both the untransformed and the transformed distributions of lengths of stay and total costs, so as to provide a graphical assessment of the efficacy of the log transformations.
In detail, we used log (base 10) transformed lengths of stay as our first outcome variable of interest, and fit a general linear model with log (length of stay) as our dependent variable, and the following main effects (fixed factors): gender (2 levels); ethnicity (4 levels); age (3 levels); entry class (11 levels); severity of illness (4 levels) and excursions (4 levels). We chose to limit consideration to a model with main effects without interaction terms, so as to obtain a general overview of how the main effects related to the outcome variable. Subsequent to fitting the general linear model, we prepared profile plots of the estimated marginal means (sometimes referred to as the least squares means) of mean lengths of stay, for each level of each factor. In this regard, the estimated marginal means and associated 95% confidence intervals were calculated on the log scale [i.e., log (length of stay)], then back-transformed to the original scale (days) for clarity. The back-transformation results in asymmetric confidence intervals, but this should present no difficulties in terms of interpretation.
We used log (base 10) transformed total costs as our second outcome variable of interest. Our modeling here is identical to what we have just described relative to lengths of stay.
RESULTS
Patient characteristics
Length of stay
| FemalesN (%) | MalesN (%) | TotalN | |
| Gender | 988 (48.8%) | 1,035 (51.2%) | 2,023 |
| Ethnicity | |||
| African American | 23 (2.3%) | 29 (2.8%) | 52 |
| Asian/Pacific Islander | 45 (4.6%) | 45 (4.3%) | 90 |
| White | 849 (85.9%) | 890 (86.0%) | 1,739 |
| Other/Unknown | 71 (7.2%) | 71 (6.9%) | 142 |
| Age (Years)1 | 73 (20 to 100) | 70 (19 to 100) | 72 (19 to 100) |
| <65 | 340 (34.4%) | 375 (36.2%) | 715 |
| 65-79 | 290 (29.4%) | 351 (33.9%) | 641 |
| ≥80 | 358 (36.2%) | 309 (29.9%) | 667 |
| BMI 1,2 | 27.1 (15.1 - 59.9) | 27.1 (15.8 - 60.0) | 27.1 (15.1 - 60.0) |
| Underweight (BMI <18.5) | 45 (5.5%) | 11 (1.3%) | 56 |
| Normal Weight (18.5 ≤ BMI <25.0) | 251 (30.5%) | 265 (31.2%) | 516 |
| Overweight (25.0 ≤ BMI <30.030.0) | 234 (28.4%) | 308 (36.2%) | 542 |
| Obese (BMI ≥30.0) | 293 (35.6%) | 266 (31.3%) | 559 |
| Severity of Illness | |||
| Minor | 75 (7.6%) | 77 (7.4%) | 152 |
| Moderate | 310 (31.4%) | 282 (27.2%) | 592 |
| Major | 423 (42.8%) | 468 (45.3%) | 891 |
| Extreme | 180 (18.2%) | 208 (20.1%) | 388 |
| Length of Stay (Days)1 | 5.0 (1.1 - 59.4) | 5.0 (1.1 - 139.4) | 5.0 (1.1 - 139.4) |
| Primary Reason for Admission | |||
| Cancer/Oncology | 39 (3.9%) | 27 (2.6%) | 66 |
| Cardiovascular | 192 (19.4%) | 228 (22.0%) | 420 |
| Diabetes | 30 (3.0%) | 29 (2.8%) | 59 |
| GI Disease - Nonsurgical | 64 (6.5%) | 76 (7.3%) | 140 |
| Infections | 191 (19.3%) | 187 (18.1%) | 378 |
| Neurological - Nonsurgical | 44 (4.5%) | 38 (3.7%) | 82 |
| Pulmonary | 83 (8.4%) | 73 (7.0%) | 156 |
| Rehabilitation | 31 (3.1%) | 59 (5.8%) | 90 |
| Renal Disease - Nonsurgical | 21 (2.1%) | 38 (3.7%) | 59 |
| Surgical Procedures | 231 (23.4%) | 214 (20.7%) | 445 |
| Other | 62 (6.3%) | 66 (6.4%) | 128 |
| Excursions3 | |||
| None | 303 (30.7%) | 336 (32.5%) | 639 |
| LT70 | 13 (1.3%) | 24 (2.3%) | 37 |
| GT180 | 549 (55.6%) | 585 (56.5%) | 1134 |
| LT70 and GT180 | 123 (12.4%) | 90 (8.7%) | 213 |
1Medians and ranges are initially reported for age, BMI, length of stay.
2BMI summary statistics are based on 823 female and 850 male patients.
3On a per patient basis, individuals were classified as having no excursions, excursions solely to glucose levels <70 mg/dL, excursions solely to glucose levels >180 mg/dL, or excursions to glucose levels both <70 mg/dL and >180 mg/dL.
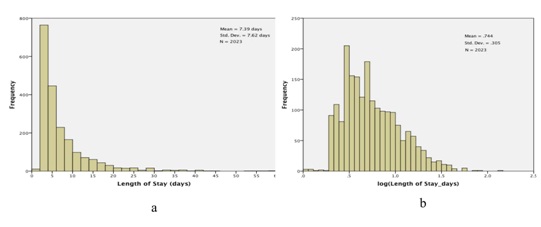 Figure 2: Lengths of Stay (LOS) for the study cohort. a) Histogram of observed lengths of stay; The X-axis has been truncated at 60 days, which excludes 3 observations: LOS=74.2 days, 81.1 days, and 139.4 days and b) Histogram of log (LOS).
We then fit a general linear model, with dependent variable log (length of stay) and the following main effects (fixed factors): gender (2 levels); ethnicity (4 levels); age (3 levels, <65, 65-79 and >79); entry class (11 levels); severity of disease (4 levels) and excursions (4 levels). Results are presented in table 2. Neither gender nor ethnicity is significantly related to length of stay: gender, F1,2000=.851, p=.356; ethnicity, F3,2000 =.864, p=.459. On the other hand, the other four factors are nominally highly significant, with p values .001 or smaller. We present profile plots of the marginal estimates of the main effects in figure 3. There are no pronounced differences in length of stay by gender or ethnicity (Figures 3a and 3b), but there is an obvious association between length of stay and severity of disease (Figure 3e). The relationship between age and length of stay (Figure 3c) is somewhat surprising: length of stay tends to decrease with increasing age. As for entry class (Figure 3d), there are three distinct subgroups relating to length of stay: (i) rehab, (ii) surgical procedures and pulmonary causes and (iii) the remaining eight admission classes. Lastly, the profile plot for excursions (Figure 3f) is quite revealing: patients experiencing excursions both to glucose levels 180 mg/dL tend to have longer hospital stays on average than other patients.
| Tests of Between-Subjects Effects | |||||
| Dependent Variable: log (LOS_days) | |||||
| Source | Type III Sum of Squares | df | Mean Square | F | Sig. |
| Corrected Model | 71.345a | 22 | 3.243 | 55.798 | .000 |
| Intercept | 116.284 | 1 | 116.284 | 2000.789 | .000 |
| Gender | .049 | 1 | .049 | .851 | .356 |
| Ethnicity | .151 | 3 | .050 | .864 | .459 |
| Age | .767 | 2 | .384 | 6.602 | .001 |
| Entry Class | 17.188 | 10 | 1.719 | 29.574 | .000 |
| Sev Illness | 38.209 | 3 | 12.736 | 219.141 | .000 |
| Excursions | 5.523 | 3 | 1.841 | 31.676 | .000 |
| Error | 116.238 | 2000 | .058 | ||
| Total | 1307.333 | 2023 | |||
| Corrected Total | 187.583 | 2022 | |||
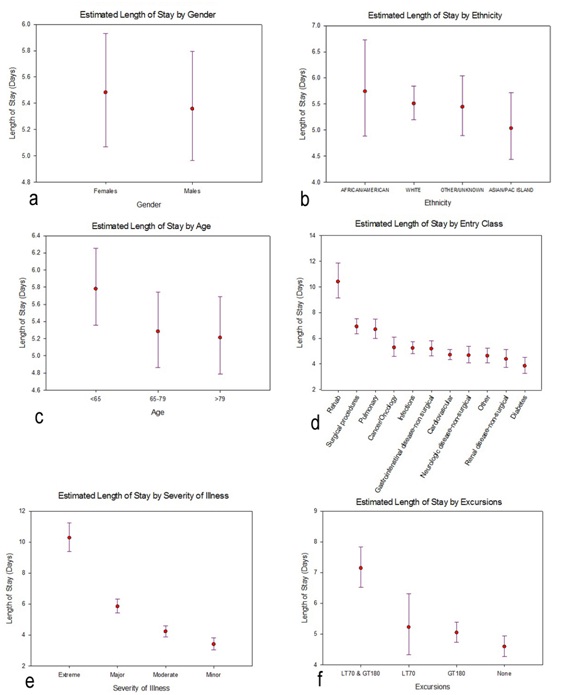 Figure 3: Profile plots of the estimated marginal means and associated 95% confidence intervals (CIs) for length of stay, separately for each factor included in the general linear model. The estimated marginal means and 95% CIs had been calculated on the log-transformed lengths of stay, then back-transformed for these profile plots. [One implication is, the confidence intervals are asymmetric]. a) Gender; b) Ethnicity c) Age d) Entry Class e) Severity of Illness f) Excursions.
Total Costs
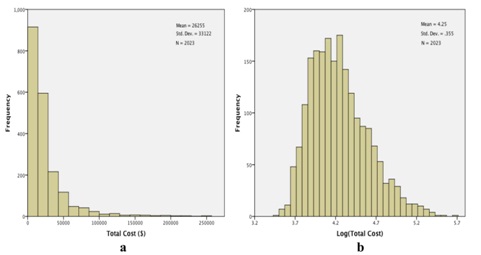 Figure 4: Total costs (TC) for the study cohort. a) Histogram of observed costs. The X-axis has been truncated at $275000, which excludes 3 observations: total costs=$309014, $345673, and $508397 and b) Histogram of log (TC). No observations were excluded in this histogram.
We proceeded to fit a general linear model to log (total costs), using the same fixed factors as we had invoked with log (length of stay). Results are qualitatively quite similar to what we have found relative to lengths of stay. Neither gender nor ethnicity is significantly related to total costs: gender, F1,2000=.003, p=.959; ethnicity, F3,2000=2.277, p=.078 (Table 3). Again, all of the other factors are significantly related to total costs (Table 3), with the profile plots elucidating these relationships (Figure 5). As with lengths of stay, total costs were unrelated to gender (Figure 5a) or ethnicity (Figure 5b), but tended to decrease with increasing age (Figure 5c). The groupings for entry class (Figure 5d) are slightly different relative to total costs compared to lengths of stay: estimated total costs for surgical procedures exceed the costs for rehab or pulmonary causes. And, as with lengths of stay, estimated total costs for extreme severity of illness (Figure 5e) and for excursions both 180 mg/dL (Figure 5f) are dominant.
| Tests of Between-Subjects Effects | |||||
| Dependent Variable: LogTotCost | |||||
| Source | Type III Sum of Squares | df | Mean Square | F | Sig. |
| Corrected Model | 108.325a | 22 | 4.924 | 67.103 | .000 |
| Intercept | 3817.164 | 1 | 3817.164 | 52020.476 | .000 |
| Gender | .000 | 1 | .000 | .003 | .959 |
| Ethnicity | .501 | 3 | .167 | 2.277 | .078 |
| Age | 2.542 | 2 | 1.271 | 17.321 | .000 |
| Entry class | 32.787 | 10 | 3.279 | 44.682 | .000 |
| Sev Illness | 59.948 | 3 | 19.983 | 272.327 | .000 |
| Excursions | 4.909 | 3 | 1.636 | 22.301 | .000 |
| Error | 146.756 | 2000 | .073 | ||
| Total | 36739.388 | 2023 | |||
| Corrected Total | 255.081 | 2022 | |||
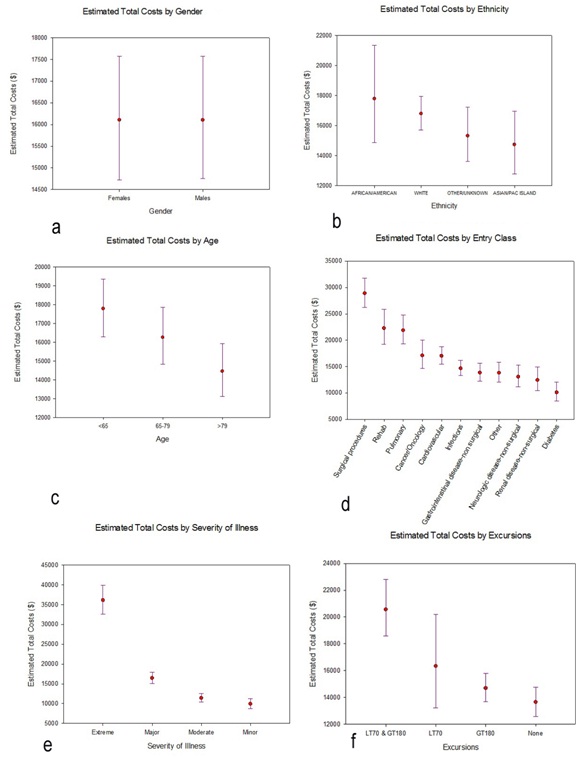 Figure 5: Profile plots of the estimated marginal means and associated 95% Confidence Intervals (CIs) for total costs, separately for each factor included in the general linear model. The estimated marginal means and 95% CIs had been calculated on the log-transformed total costs, then back-transformed for these profile plots. a) Gender b) Ethnicity c) Age d) Entry Class e) Severity of Illness f) Excursions.
DISCUSSION
We had previously proposed [26] a metric of glucose variability based on excursions of individual patient glucose levels outside a targeted range (70 to 180 mg/dL), that might be used systematically and in a complementary fashion to trigger or evaluate interventions established to improve glucose management. In this paper we examined the merit and utility of this metric, and found that patients who experienced excursions in glucose levels both below 70 mg/dL and above 180 mg/dL had longer lengths of stay and total costs than other patients, even after controlling for other potential risk factors in a multivariable analysis. This is not a surprising finding [29] in so far as the range of a patient’s observed glucose levels during hospitalization is a marker of glycemic variability, patients with maximal glucose variability incur longer lengths of stay and total costs than other patients.
Neither gender nor ethnicity was significantly related to either lengths of stay or total costs in our cohort, even though both factors seem to be associated with lengths of stay for particular diseases [30,31]. That DRG and severity of disease are related to lengths of stay and costs is unsurprising, but the inverse relationship between age and the outcome variables is unexpected. These data were collected prior to the introduction of widespread government-mandated healthcare coverage for most Americans, and we speculate that the age associations might well be different if this study were conducted more recently.
Our method of analysis, entailing general linear models with several covariates regressed on the log transformed outcome variables of interest, lengths of stay and total costs, is fairly straight forward, although alternative methods of analysis [e.g., negative binomial regression as in [26] on the untransformed outcome variables] are available. The analyses can establish the joint statistical significance of the various factors as putative predictors of the outcomes in this regard we consistently found that age, entry class, severity of illness and excursions [but not gender or ethnicity] were jointly significant predictors of lengths of stay and total costs. We caution that the exceptionally small p-values for the main effects entry class, severity of illness, and excursions are also reflective of our large sample size (which is nominally a strength of our study). Hence our primary focus was comparison of the levels of each factor relative to outcomes. Lengths of stay and total costs were highly correlated, so that the high level of concordance [both statistical significance and orderings of levels] between the two analyses is unexceptional.
Several limitations should be considered in the interpretation of our findings. (i) First, due to the observational nature of this study, blood glucose monitoring was not necessarily comprehensive and we may have missed individual patient excursions. Future studies should consider more systematic daily monitoring schemes, for example through the use of continuous glucose monitors. (ii) We introduced potential predictor variables for lengths of stay and total costs in Section 2, but there are clearly other variables that could influence glucose levels and variability - e.g., diabetic status, administration of glucose altering medications such as insulin or gluco corticosteroids, total parenteral nutrition, eating and activity patterns during hospitalization. Such detailed information was unavailable to us. (iii) Unfortunately, much of the available BMI data was unreliable or erroneous, so we could not include BMI as a potential covariate in our models. The electronic record system implemented at this hospital did not preclude the most common error we uncovered, namely, heights being entered in inches or occasionally feet rather than cm and weights recorded in pounds rather than kg. We consider the summary statistics on BMI we reported in table 1 to be based on “reliable” BMIs from our database, but we were reluctant to restrict subsequent analyses to a subset of our original cohort based on reliable BMIs. Nevertheless, we recognize that BMI may also be significantly related to lengths of stay and total costs [32]. (iv) Lastly, this analysis was based on one hospital sample and examined a single metric of glucose variability. Moving forward, research should examine the utility of the glucose excursion rate metric in other (diverse) healthcare systems for cross-validation purposes. Studies that investigate the additive value of glucose excursion rates over and above the information conveyed by patient-day-weighted means, and/or compare the proposed glucose excursion rate metric against other measures of glucose variability would also represent valuable additions to the literature.
In conclusion, we have found that patients who experience excursions in blood glucose levels into both hyper and hypoglycemic ranges had longer lengths of stay on average and incurred greater costs than other patients, after adjusting for age, entry class and severity of illness. This metric for glucose variability can easily be used to leverage improvements in clinical care, and may allow more consistent analysis of patient outcomes across hospitals and health systems [33-35]. We remark that age, entry class and severity of illness cannot be controlled at time of admission, but excursions are the one factor that can be controlled or influenced by hospital care. Thus an immediate implication of our study is that hospital resources ought to be targeted to limit patient glucometric variability.
ACKNOWLEDGMENT
The author thanks the reviewers for perceptive comments that led to improved presentation.
REFERENCES
- Huang ES, Basu A, O'Grady M, Capretta JC (2009) Projecting the future diabetes population size and related costs for the U.S. Diabetes Care 32: 2225-2229.
- Centers for Disease Control and Prevention. Diabetes Public Health Resource, Number (in Thousands) of Hospital Discharges with Diabetes as Any-Listed Diagnosis, United States, 1988-2009. Centers for Disease Control and Prevention, Georgia, USA.
- Umpierrez GE, Isaacs SD, Bazargan N, You X, Thaler LM, et al. (2002) Hyperglycemia: an independent marker of in-hospital mortality in patients with undiagnosed diabetes. J Clin Endocrinol Metab 87: 978-982.
- Falciglia M, Freyberg RW, Almenoff PL, D'Alessio DA, Render ML (2009) Hyperglycemia-related mortality in critically ill patients varies with admission diagnosis. Crit Care Med 37: 3001-3009.
- Krinsley JS (2003) Association between hyperglycemia and increased hospital mortality in a heterogeneous population of critically ill patients. Mayo Clin Proc 78: 1471-1478.
- Norhammar A, Tenerz A, Nilsson G, Hamsten A, Efendíc S, et al. (2002) Glucose metabolism in patients with acute myocardial infarction and no previous diagnosis of diabetes mellitus: a prospective study. Lancet 359: 2140-2144.
- Matz K, Keresztes K, Tatschl C, Nowotny M, Dachenhausen A, et al. (2006) Disorders of glucose metabolism in acute stroke patients: an underrecognized problem. Diabetes Care 29: 792-797.
- Capes SE, Hunt D, Malmberg K, Gerstein HC (2000) Stress hyperglycaemia and increased risk of death after myocardial infarction in patients with and without diabetes: a systematic overview. Lancet 355: 773-778.
- Meier JJ, Deifuss S, Klamann A, Launhardt V, Schmiegel WH, et al. (2005) Plasma Glucose at Hospital Admission and Previous Metabolic Control Determine Myocardial Infarct Size and Survival in Patients With and Without Type 2 Diabetes: The Langendreer Myocardial Infarction and Blood Glucose in Diabetic Patients Assessment (LAMBDA). Diabetes Care 28: 2551-2553.
- McAlister FA, Majumdar SR, Blitz S, Rowe BH, Romney J, et al. (2005) The relation between hyperglycemia and outcomes in 2,471 patients admitted to the hospital with community-acquired pneumonia. Diabetes Care 28: 810-815.
- Murphy CV, Coffey R, Wisler J, Miller SF (2013) The relationship between acute and chronic hyperglycemia and outcomes in burn injury. J Burn Care Res 34: 109-114.
- Won EJ, Lehman EB, Geletzke AK, Tangel MR, Matsushima K, et al. (2015) Association of postoperative hyperglycemia with outcomes among patients with complex ventral hernia repair. JAMA Surg 150: 433-440.
- van den Berghe G, Wouters P, Weekers F, Verwaest C, Bruyninckx F, et al. (2001) Intensive insulin therapy in critically ill patients. N Engl J Med 345: 1359-1367.
- Umpierrez GE, Hellman R, Korytkowski MT, Kosiborod M, Maynard GA, et al. (2012) Management of hyperglycemia in hospitalized patients in non-critical care setting: an endocrine society clinical practice guideline. J Clin Endocrinol Metab 97: 16-38.
- Umpierrez GE, Smiley D, Jacobs S, et al. (2011) Randomized study of basal-bolus insulin therapy in the inpatient management of patients with type 2 diabetes undergoing general surgery (RABBIT 2 surgery). Diabetes Care 34: 256-261.
- Griesdale DE, de Souza RJ, van Dam RM, Heyland DK, Cook DJ, et al. (2009) Intensive insulin therapy and mortality among critically ill patients: a meta-analysis including NICE-SUGAR study data. CMAJ 180: 821-827.
- Wiener RS, Wiener DC, Larson RJ (2008) Benefits and risks of tight glucose control in critically ill adults: a meta-analysis. JAMA 300: 933-944.
- Kansagara D, Fu R, Freeman M, Wolf F, Helfand M (2011) Intensive insulin therapy in hospitalized patients: a systematic review. Ann Intern Med 154: 268-282.
- Cook CB, Kongable GL, Potter DJ, Abad VJ, Leija DE, et al. (2009) Inpatient glucose control: a glycemic survey of 126 U.S. hospitals. J Hosp Med 4: 7-14.
- Swanson CM, Potter DJ, Kongable GL, Cook CB (2011) Update on inpatient glycemic control in hospitals in the United States. Endocr Pract 17: 853-861.
- Magaji V, Johnston JM (2011) Inpatient management of hyperglycemia and diabetes. Clincal diabetes 29: 3-9.
- http://www.hospitalmedicine.org/Web/Quality_Innovation/Implementation_Toolkits/Glycemic_Control/Web/Quality___Innovation/Implementation_Toolkit/Glycemic/Track_Performance/Introducing_Glucometrics.aspx
- Schnipper JL, Magee M, Larsen K, Inzucchi SE, Maynard G (2008) Society of Hospital Medicine Glycemic Control Task Force. Society of Hospital Medicine Glycemic Control Task Force summary: practical recommendations for assessing the impact of glycemic control efforts. J Hosp Med 3: 66-75.
- Goldberg PA, Bozzo JE, Thomas PG, Mesmer MM, Sakharova OV, et al. (2006) “Glucometrics”--assessing the quality of inpatient glucose management. Diabetes Technol Ther 8: 560-569.
- Eslami S, Taherzadeh Z, Schultz MJ, Abu-Hanna A (2011) Glucose variability measures and their effect on mortality: a systematic review. Intensive Care Med 37: 583-593.
- Koziol J, Johnson K, Brenner K, Fortmann A, Morrisey R, et al. (2015) Novel approach to inpatient glucometric monitoring and variability in a community hospital setting. J Diabetes Sci Tecnhol 9: 246-256.
- Kulinskaya E, Knight E, Kornbrot D, Benton P (2001) The use of log and power transformations in the analysis of length of stay data. Casemix Quarterly 3.
- Kulinskaya E, Kornbrot D, Gao H (2005) Length of stay as a performance indicator: robust statistical methodology. IMA Journal of Management Mathematics 16: 369-381.
- Mendez CE, Mok KT, Ata A, Tanenberg RJ, Calles-Escandon J, et al. ( 2013) Increased glycemic variability is independently associated with length of stay and mortality in noncritically ill hospitalized patients. Diabetes Care 36: 4091-4097.
- Ravi P, Sood A, Schmid M, Abdollah F, Sammon JD, et al. (2015) Racial/Ethnic disparities in perioperative outcomes of major procedures: results from the National Surgical Quality Improvement Program. Ann Surg 262: 955-964.
- Carter EM, Potts HW (2014) Predicting length of stay from an electronic patient record system: a primary total knee replacement example. BMC Medical Informatics and Decision Making 14: 26.
- Korda RJ, Joshy G, Paige E, Butler JR, Jorm LR,et al. (2015) The relationship between body mass index and hospitalisation rates, days in hospital and costs: findings from a large prospective linked data study. PLoS One 10: 0118599.
- Satya Krishna SV, Kota SK, Modi KD (2013) Glycemic variability: Clinical implications. Indian J Endocrinol Metab 17: 611-619.
- Frontoni S, Di Bartolo P, Avogaro A, Bosi E, Paolisso G, et al. (2013) Glucose variability: An emerging target for the treatment of diabetes mellitus. Diabetes Res Clin Pract 102: 86-95.
- Picconi F, Di Flaviani A, Malandrucco I, Giordani I, Longo S, et al. (2012) The need for identifying standardized indices for measuring glucose variability. J Diabetes Sci Technol 6: 218-219.
Citation: Koziol JA (2016) Association of Glucometric Variability with Clinical and Economic Outcomes in a Community Hospital Setting. J Diabetes Metab Disord 3: 016.
Copyright: © 2016 James A Koziol, et al. This is an open-access article distributed under the terms of the Creative Commons Attribution License, which permits unrestricted use, distribution, and reproduction in any medium, provided the original author and source are credited.