Attachment Orientation in Older Patients with Common Mental Disorders: A Cross-Sectional Study
*Corresponding Author(s):
Meinolf PetersInstitute For Psychotherapy For The Elderly, Department Of Education, Philipps-University Marburg, Schwanallee 48a, 35037 Marburg, Germany
Email:info@alterspsychotherapie.de
Abstract
The theory of attachment is one of the most influential developmental psychological theories today, but it has only recently been applied to those of advanced age. To date, differences in the prevalence of attachment styles have been determined. However, little is currently known about attachment orientations in emotionally distressed middle-aged and older people. In the present study, a clinical sample in a psychosomatic clinic (N=150) and a nonclinical comparative sample (N=153), both aged between 40 and 80 years, were examined using the Experience in Close Relationships - Revised (ECR-R) questionnaire, which measures anxious and avoidant attachment orientation in two dimensions. In addition, two health-related variables were recorded (psychological symptoms and psychological well-being). The clinical sample exhibited high values in both attachment anxiety and attachment avoidance compared to the nonclinical sample. For anxiety attachment, there are lower values in the oldest group, but only with a small effect size. The regression analysis shows a high correlation of anxious attachment orientation with symptom burden, while a high avoidant attachment orientation correlates negatively with well-being, but age shows a positive correlation with well-being.
Conclusion: Although the age differences are less pronounced than expected, the results show that attachment orientation is an important dimension for understanding mental illness in older patients, especially anxious attachment. However, for well-being, avoidant attachment is more important. The nature of attachment orientation provides important clues for the direction of therapeutic interventions. The promotion of secure attachment then becomes an overriding therapeutic goal.
Keywords
Attachment theory; Attachment orientations; Common mental disorder; Older patients
Introduction
Attachment theory is undoubtedly one of the most influential developmental psychological theories today. Developed by John Bowlby [1-3], the theory’s basic assumption is that the evolutionarily anchored attachment system causes a person to seek out someone who provides security in threatening situations. This formulation and its derivation from various branches of knowledge, including ethology, have far-reaching consequences, especially for the developmental psychology of children and adolescents. The extension of attachment theory to increased ages (>60 years), which is a much younger discipline [4], is relevant because its topics, such as attachment, loss and separation, also have great significance in old age. Numerous studies are available that address different aspects of attachment and attachment patterns in older age [4,5].
In the course of the development of attachment theory, the question of attachment patterns or styles has gained particular interest. It is assumed that specific forms of dealing with bonding and separation develop based on inner representations (‘inner work models’). In addition to secure attachment, which is based on the trust that a good attachment figure is available, two forms of insecure attachment have been postulated and often empirically confirmed, namely, insecure-anxious (or entangled) and insecure-avoiding attachment. In the former, fear of loss is countered by active attachment behaviour, while the affected person seeks closeness and support from others because he or she feels that only with their help can they achieve attachment security. In the case of insecure-avoiding attachment, the opposite reaction occurs, i.e., those affected emphasise their autonomy and independence in a special way. In the anxious attachment style, attachment behaviour is activated in a hyperactive way, while in the avoidant style, attachment behaviour is deactivated [6].
The question of the distribution of attachment patterns has also attracted particular interest with regard to older people [5]. Magai et al., [7] observed a negative correlation between attachment security and age in a sample with an average age of 63 years while avoiding attachment behaviour was positively correlated with age. Diehl et al., [8] examined three age groups with average ages of 30, 50 and 70 years each. Their results illustrated that 16% of the youngest age group, 22% of the middle group and 40% of the oldest group were attached in an uncertain-avoidable manner. In a study by Magai et al., [9], the number of insecure-avoidably attached people was even higher, at 78% of the older sample population. Consendine and Fiori [10] identified a similar distribution in a group of 50- to 70-year-olds in which 12.8% were securely bound, 77.6% insecure-avoidable and 9.6% insecure-knit. The proportion of those attached in an insecure-avoidable way was also particularly high in a study by Consendine et al., [11] at 83%, while 13% were attached securely and 4% were attached in an insecure-knit way. The proportion of older people with anxious-ambivalent attachments is lower, while the proportion with insecure-avoidant attachments is higher, and the findings on secure ties are inconsistent. The reasons are not completely clear, but with regard to the higher prevalence of avoidant attachment, there are indications that this occurs in particular after losses, especially the loss of a partner [12], while the lower prevalence in anxious attachment can be explained with the help of the theory of socioemotional selectivity [13], i.e., older people dissolve tense relationships when growing older [14]. Gender differences in attachment orientation weaken or disappear with age [10,15].
The reported results were obtained in studies with a cross-sectional design. The only longitudinal study, covering a period of 6 years, was presented by Zhang and Labouvie-Vief [16]. This study confirmed the increase in insecure-avoidant attachment with age; however, secure attachment also increased, while insecure-ambivalent attachment was found to transition into one of the other two attachments. In the recent past, a method-critical discussion has begun that focuses on the meaningfulness of the formation of attachment styles and their taxonomy. The discussion ‘types versus dimensions’ refers to the question of whether attachment orientations are not to be understood more in terms of processes and whether a categorical classification leads to loss of information. As a consequence, a dimensional approach has increasingly become the basis of empirical work, with attachment-related fear and attachment-related avoidance being investigated as the basal dimensions (see below) [14,17]. To date, however, only a few studies have been conducted with older adults using a dimensional conceptualisation [14].
The present study
Two aspects are particularly significant in connection with attachment relationships. Numerous studies show a connection between attachment patterns and mental disorders, and a number of studies have shown that insecure attachments in early childhood are associated with an increased risk of mental illness in adult life [18]. In relation to older age, the relationship between attachment patterns and mental illness has been little studied. Spence et al., [19] were able to show that older people with an avoidant attachment pattern have an increased risk of social isolation because they are less able to accept dependency and social support, but this also increases the risk of depression. However, participants were older people without mental illness. Von Assche et al., [20] found a link between early trauma and depression and anxiety in old age, which was moderated by attachment insecurity, and Ogle et al., [21] found a link between early traumata, attachment and PTSD severity in older age. However, even these clinically important studies did not include patients.
The WHO [22] has pointed out that mental health is expressed not only in the absence of symptoms but also in positive mental well-being. However, the maintenance or improvement of well-being is also considered a central feature of successful ageing, a close connection between well-being and attachment security has repeatedly been found in older people [23], and securely attached older individuals have higher levels of psychological well-being [24,25]. Several authors were able to show that both psychological symptoms and well-being are connected and that stable well-being protects against health problems [26].
The present study dealt with the question of the attachment orientations of older patients with common mental disorders compared to a sample of clinically unremarkable test persons. The following hypotheses were formulated:
- Different age groups differ in their attachment-related orientation, i.e., it is to be expected that attachment-related anxiety is less pronounced in the oldest group and avoidant behaviour is more pronounced in the oldest group. However, the question arises whether this occurs equally in both samples or whether a different pattern occurs in the clinical group. It is assumed that psychologically stressed older people are less successful in reducing anxious attachment orientations, while avoidant attachment orientations are just as much or even more pronounced in this group
- The attachment orientation of a clinical sample of older patients shows more insecure orientations than in the nonclinical comparison sample. Specifically, it is expected that the clinical sample will show more attachment anxiety and more attachment avoidance. As an exploratory outcome, an interaction effect was also tested
- It is expected that health-related aspects, especially the burden of psychological symptoms and psychological well-being, are related to attachment orientation, i.e., psychological symptoms and reduced well-being with more insecure attachment orientation
Methods
Study design and participants
The present cross-sectional study was performed in the context of the study ‘social cognitive deficits in older patients’. A two-factorial design was developed to test the formulated hypotheses. Factor 1 can be described as a setting factor, i.e., data were collected on both clinical and nonclinical samples. The clinical sample consisted of consecutive samples of patients who were treated in two clinics for common mental disorders, stratified into three age groups (40-54 years: n = 50; 55-69 years: n = 50; >70 years: n = 50). Thus, it is a heterogeneous sample comprising different mental disorders of the ICD10 Chapters F3 and F4. In the clinical sample, mental disorders were diagnosed in a clinical consensus procedure by at least two experienced clinicians based on the criteria of the ICD-10.
In older patients, these clinical pictures are less defined and show more overlap. More than 80% of depressed older patients exhibit concomitant anxiety symptoms [27]. The comorbidity of depression and anxiety disorders is significantly higher in old age than in younger years [28], and a more somatic presentation of symptoms in depression occurs with increased age [29].
For comparison, a nonclinical sample was also stratified for the same three age groups as the clinical sample (40-54 years: n = 48; 55-69 years: n = 57; >70 years: n = 47), educational level and gender. This sample was obtained in different contexts (personal contacts, church choirs, meeting places, etc.). The prerequisite was that no psychotherapeutic or psychiatric treatment had taken place in the last 3 years. In a short interview, possible psychological symptoms were clarified. Factor 2 refers to three age groups, 40-54, 55-69 and 70 and older. Therefore, age groups were chosen that were close enough to each other to be able to detect differences in the second half of life. In both samples of all subjects over 65 years of age, the Mini-Mental State (MMS) [30] was used as a screening instrument to exclude dementia. Subjects with a value less than 27 were not included in the sample. Patients with a personality disorder as the initial diagnosis were also excluded. With respect to gender distribution, a stratification of samples was intended. The proportion of men should not be higher than 30%, which is based on the proportion of men in psychosomatic clinics, and the proportion should be the same in the different age groups. Stratification was also sought with regard to education. This survey was conducted between 2016 and the beginning of 2017.
Measures
To assess the attachment relationship, one of the most common questionnaires was used [31]. It records the conscious experience of attachments and thus a different level than, for example, the attachment interview [32], which includes an unconscious dimension. The Experience in Close Relationships - Revised (ECR-R), which goes back to the work of Fraley’s working group [31], has been widely used. The ECR-R records partnership-related attachment behaviour, i.e., in the instruction, the respondent is asked to refer to emotionally significant-current or past-partnerships when answering the questions. The attachment orientations are recorded in two dimensions, namely, Attachment-related fear (AnxAtt) (e.g., abandonment) (example item: ‘I’m afraid this person may abandon me’) and attachment-related avoidance (AvloidAtt) (e.g., close relationships) (example item: ‘I don’t feel comfortable opening up to this person’). High values on the anxiety scale lead to hyper activating strategies in relevant situations, whereas high values on the avoidance scale lead to deactivating strategies. The original English version of the questionnaire contains 36 items taken from existing commitment questionnaires [33].
The questionnaire was translated into German by Ehrenthal et al., [34]. The two scales each comprise 18 items, which are assessed on a Likert scale from 1 (do not agree at all) to 7 (agree completely). Fourteen items are formulated negatively, i.e., the answer requires a rethink to be able to answer them. In several studies, the factor structure, as well as the internal consistency and test-retest reliability in a clinical and nonclinical sample, were examined with good results [15,34]. Sibley, Fischer & Liu [35] also confirmed the factor structure, high temporal stability and convergent and discriminating validity. In the data analysed here, Cronbach’s alpha for the attachment-related anxiety scale was 0.90 and for the attachment-related avoidance scale was 0.89.
The following additional variables were taken into account:
- Psychosocial health: The HEALTH-49 is a questionnaire for assessing psychosocial health [36]. The following scales were recorded: ‘mental and somatoform complaints’ (HEALTH-PSS) and ‘mental well-being’ (HEALTH.WB). The cut-off value of the HEALTH-PSS is 0.68. Twenty-eight people in the nonclinical sample had values above this value, and 9 of the clinical sample had values below this value. These were not taken into account in some analyses.
- Sociodemographic variables: In addition, sociodemographic (education, gender, age) and health-related data (in the clinical sample: diagnosis and comorbidity) were recorded. Education was dummy coded, with middle (10 years) and high education (12 years) vs. low education (9 years). Partnership was dichotomised into yes or no
Statistical analysis
The questionnaires showed that a total of 10 subjects had not completed the ECR: 8 from the clinical sample and 2 from the nonclinical sample. Five subjects in each of the middle and oldest groups and none of the youngest group were among the non responders. Statistical analysis of the data also revealed that some patients had apparently answered according to a fixed pattern, i.e., they had answered all questions either with 1 or 7, although 14 questions contained negative formulations. This applied to 3 patients in the middle group, 4 in the oldest group, and none from the youngest group, all of the clinical sample. These questionnaires were excluded from further analysis, but this reduced the sample size. Missing values were replaced using the expectation maximisation method.
The evaluation was carried out using SPSS-25. For each of the attachment dimensions, two-factorial analyses of variance (ANOVA) with subsequent post hoc comparisons were calculated, whereby the Least Significant Difference (LSD) was selected. To assess differences, the effect size eta square was calculated, where values between .01 and .06 are considered small, between 0.06 and 0.14 medium and >0.14 large [37]. The connection of the attachment scales to clinically important scales was assessed by three linear multivariate regression analyses (method ENTER) with HEALTH-PSS and HEALTH-WB as criteria and the attachment scales, age, gender, education and partnership as predictors. The chosen sample size allows the detection of differences in the mean with a medium effect size at an alpha level of 5% and a power of 80%, both in the analyses of variance and the t-test in the chosen primary outcomes. In the linear regression models, a small effect size of f = 0.05 could be detected (with alpha 5%, power 80% and 10 predictor variables). All analyses were conducted using SPSS (v.25).
Results
Sample characteristics
Table 1 shows the sociodemographic data. The sample size refers to the number of test subjects who were ultimately included in the evaluation. The samples could not be completely stratified. At the educational level, more persons in the nonclinical sample had higher educational qualifications, and in the partnership group, more persons in the nonclinical sample were married, whereas in the clinical sample, more persons were separated, divorced or widowed. In the nonclinical sample, although not significantly, there was a slightly higher proportion of men than woman.
|
|
Clinical sample |
Nonclinical Chi² sample |
|
|
Sample |
150 |
153 |
0.77 |
|
Age 40-54 |
50 |
48 |
|
|
55-69 |
50 |
57 |
|
|
=>70 |
50 |
47 |
|
|
Sex |
0.41 |
||
|
Men |
47 (34%) |
57 (38%) |
|
|
Women |
95 (66%) |
94 (62%) |
|
|
Education |
0.01 |
||
|
Primary school |
42% |
31% |
|
|
Middle school |
32% |
35% |
|
|
Higher school |
18% |
33% |
|
|
Other |
8% |
1% |
|
|
Partnership |
0.04 |
||
|
No partner |
9% |
7% |
|
|
Married/partnership |
61% |
73% |
|
|
Separated/divorced |
19% |
12% |
|
|
Widowed |
11% |
8% |
|
Table 1: Sociodemographic sample findings (T tests or Chi² tests).
The following diagnoses were primarily represented: 77% with affective disorders (including 35% with F32 and 40% with F33), 7% with anxiety disorders (including 5.4% gen. anxiety disorder), 5% with adaptation disorders, 8% somatoform disorders and 3% posttraumatic stress disorder. Somatic comorbidity was 87%, most frequently including migraine and headache, which together accounted for 40%.
Mean scores and correlations of the scales
First, the variables included were correlated with each other; mean values and standard deviations are also listed in table 2. There were a number of significant correlations, especially between the health-related and attachment scales, almost all in the range of medium effect sizes. The correlation of the variable age with the attachment-related scales is only significant in relation to attachment-related anxiety, but only with a small effect size, i.e., attachment-related anxiety weakens somewhat with age. Well-being, on the other hand, increases somewhat with age but again only with a small effect size. Mean scores and standard deviations of the two HEALTH scales were for the clinical samples HEALTH-PSS 1.59 (0.81) and HEALTH-WB 1.37 (0.82) and the nonclinical sample HEALTH-PSS 0.49 (0.41) and HEALTH-WB 0.64 (0.63).
|
|
M (SD) |
AnxAtt |
AvoidAtt |
Age |
Sex |
Educ. M. |
Educ. H. |
|
Setting |
-0.38** |
-0.29** |
0.01 |
0.03 |
0.18** |
||
|
HEALTH-PSS |
1.04 (0.85) |
0.50** |
0 .38** |
-0.05 |
0.18** |
0.00 |
-0.16** |
|
HEALTH-WB |
2.06 (1.01) |
-0.41** |
-0.41** |
0.16** |
-0.15* |
-0.05 |
0.13* |
|
AnxAtt |
2.66 (1.22) |
0.44** |
-0.13* |
0.05 |
-0.02 |
0.06 |
|
|
AvoidAtt |
2.68 (1.15) |
0.09 |
0.08 |
-0.09 |
-0.05 |
||
|
Age |
-0.12* |
-.013* |
|||||
|
Sex |
0.11* |
-0.06 |
Table 2: Mean scores, standard deviation and correlations of the sales.
Note: HEALTH-PSS = Psychic and Somatic Symptoms, HEALTH-WB = Well-Being, AnxAtt = Anxiety Attachment, AvoidAtt = Avoidance Attachment, sex men = 1, women = 2, Educ.m. =Education middle, Educ.h. = Education high
Some correlations were calculated separately for both samples (preslash clinical, postslash nonclinical sample):
- Anxiety attachment with age -0.13*/-0.14*, with HEALTH-PSS 0.41**/0.24**, with HEALTH-WB -0.26**/-0.18*
- Avoidance Attachment with age 0.09/0.10, with HEALTH-PSS 0.27**/0.29**, with HEALTH-WB -0.28**/0.34**.
The two attachment scales correlate to 0.36** in the clinical sample and to 0.38** in the nonclinical sample.
Analysis of the attachment dimensions
With respect to attachment-related anxiety, the two-factorial analysis of variance (Table 3) yielded a significant result for the factor setting (F(1,258) 64.17, p = 0.000, eta 0.200) with large effect sizes and significant post hoc effect sizes between the youngest and the oldest group (40-54 with 55-69 eta 0.089, 40-54 with 55-69 eta 0.053, 55-69 with older than 70 eta 0.794). There was also a significant result for the age factor (F(2,257) 2.953, p = 0.052, eta 0.022), but only with a small effect size. There was no interaction effect (F(2,257) 0.109, p = 0.897, eta 0.001). Therefore, attachment anxiety was significantly more pronounced in the clinical sample than in the nonclinical sample, with high effect strength, but there was only a small difference among the age groups.
|
Attachment orientations |
40-54 |
55-69 |
≥70 |
|
Attachment anxiety |
|||
|
Clinical Nonclinical |
3.44 (1.20) 2.31 (1.14) |
3.14 (1.35) 1.96 (0.55) |
3.00 (1.34) 1.98 (0.78) |
|
Attachment avoidance |
|||
|
Clinical Nonclinical |
2.72 (1.09) 2.13 (0.93) |
3.31 (1.35) 2.22 (0.84) |
3.01 (1.17) 2.37 (1.03) |
Table 3: Mean score, standard deviation and sample.
With respect to avoidance of attachment, a significant result with a medium effect strength was observed for the setting factor (F(1,259) 34.693, p = 0.000, eta 0.114), and no significant result was observed for the age factor (F(2,259) 2.529, p = 0.082, eta 0.018), where only a tendency in the expected direction was discernible. No interaction was found (F(2,259) 1.509, p = 0.223, eta 0.011). Thus, attachment avoidance was significantly more pronounced in the clinical sample than in the nonclinical sample (Figures 1 and 2).
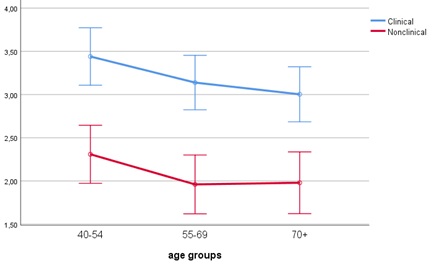 Figure 1: Attachment anxiety, clinical and nonclinical samples.
Estimated marginal means [95% CI] of the attachment anxiety scale for the three different age groups in the nonclinical (red line) and clinical samples (blue line).
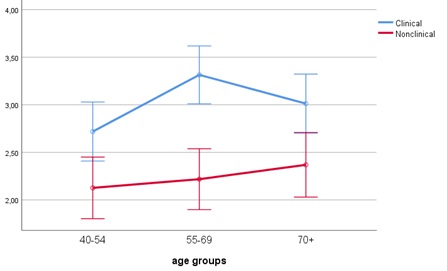 Figure 2: Attachment avoidance, clinical and nonclinical sample.
Estimated marginal means [95% CI] of the attachment avoidance scale for the three different age groups in the nonclinical (red line) and clinical samples (blue line).
Multivariate analysis of the attachment scales with the two health-related scales
Three regression analyses were conducted to determine the multivariate relationships of the included scales. The first, in which HEALTH-PSS was included as a criterion, involved only the clinical sample (R = 0.46, R² = 0.21, F(7,129) 4.994***). The predictor with the highest beta weight was Anxious Attachment Orientation (AnxAtt), i.e., higher scores on this variable are associated with increased symptom burden. In addition, gender contributed significantly to the variance explanation, i.e., the female gender is associated with a higher symptom burden (Table 4).
|
Predictor |
B |
SD |
β |
CI 95% |
|
Age |
-0.006 |
0.006 |
-0.084 |
[-0.019.006] |
|
Sex |
0.338 |
0.140 |
0.191* |
[0.061.616] |
|
Education middle |
0.048 |
0.152 |
0.027 |
[-0.254.349] |
|
Education high |
-0.062 |
0.180 |
-0.029 |
[-0.418.294] |
|
Partnership |
-0.133 |
0.134 |
-0.080 |
[-0.398.131] |
|
AnxAtt |
0.218 |
0.053 |
0.348*** |
[0.114.323] |
|
AvoidAtt |
0.068 |
0.059 |
0.100 |
[-0.048.184] |
Table 4: Linear regression analysis, criterion HEALTH-PSS.
Note: H-PSS = Psychic and Somatic Complaints, sex men = 1, women = 2, partnership without partner = 1, with partner = 2, AnxAtt = Anxiety Attachment, AvoidAtt = Avoidant Attachment
sex men = 1, women = 2, partnership without partner = 1, with partner = 2
In the two further regression analyses, the variable HEALTH-WB, i.e., psychological well-being, was entered as a criterion. In the analysis related to the clinical sample (R = 0.40, R² = 0.16, F(7,129) 3.539***), Avoidant Attachment Orientation (AvoidAtt) had the largest beta weight, i.e., a stronger avoidant attachment orientation is associated with reduced well-being. This was followed by the variables Education middle and Gender, i.e., a middle education level and female gender are also associated with reduced well-being in the clinical sample. In the nonclinical sample (R = 0.42, R² = 0.18, F(7,117) 3.562***), the variable age had the highest beta weight, i.e., higher age is associated with higher psychological well-being, while an avoidant attachment orientation is associated with reduced well-being (Table 5).
|
Variable |
Clinical Sample |
Nonclinical Sample |
||||||
|
B |
SD |
β |
CI 95% |
B |
SD |
β |
CI 95% |
|
|
Age |
0.006 |
0.006 |
0.085 |
[-0.006,.018] |
0.015 |
0.004 |
0.328*** |
[0.007,.023] |
|
Sex |
-0.286 |
0.14 |
-0.167* |
[-0.564,.009] |
0.024 |
0.103 |
0.02 |
[-0.180,.227] |
|
Education middle |
-0.346 |
0.152 |
-0.205* |
[-0.648,.045] |
0.02 |
0.127 |
0.017 |
[-0.231,.272] |
|
Education high |
-0.203 |
0.18 |
-0.099 |
[-0.559,.153] |
0.156 |
0.127 |
0.131 |
[-0.096,.409] |
|
Parntership |
-0.139 |
0.134 |
-0.086 |
[-0.404,.126] |
0.064 |
0.114 |
0.048 |
[-0.162,.290] |
|
AnxAtt |
-0.09 |
0.053 |
-0.147 |
[-0.194,.095] |
-0.049 |
0.062 |
-0.073 |
[-0.172,.074] |
|
AvoidAtt |
-0.152 |
0.059 |
-0.231*** |
[-0.268,.036] |
-0.167 |
0.056 |
-0.264*** |
[-0.279,-.056] |
Table 5: Linear regression analysis for the Clinical and Nonclinical Sample, Criterion HEALTH-WB.
Note: HEALTH-WB = Wellbeing, sex men = 1, women = 2, partnership without partner = 1, with partner = 2, AnxAtt = Anxiety Attachment, AvoidAtt = Avoidant Attachment
Discussion
Recently, a number of studies have investigated older age attachment relationships, but all have been based on samples of the general population [5]. In the present study, attachment orientations-attachment-related anxiety and avoidance-were examined in a sample of mentally stressed middle-aged and older patients and compared to a clinically unstressed sample of subjects of the same age. It is important to note that the questionnaire used captures partnership-related attachment, i.e., a specific attachment relationship. Currently, it is generally no longer assumed that there is an all-encompassing hierarchy of attachment relationships but rather a hierarchy of attachment relationships [17], so it is quite possible that the results found here have relevance primarily in partnership relationships but cannot be generalised to all attachment relationships without further research.
The hypotheses related to expected age differences in the attachment scales have only been confirmed to a limited extent. If this result corresponds to the formulated hypothesis, it is confirmed with regard to attachment-related anxiety in the variance analyses, but only with a small effect size, and a significant negative correlation with age. However, the expectation that the subjects in the clinical group would be less successful in reducing anxious attachment orientation could not be confirmed; an interaction effect did not occur. On the scale of avoidant attachment orientation, no significant age effect was found, but only a slight tendency in this direction.
What are the reasons that age differences are only poorly reflected? The survey method could be responsible for this (see below) or the composition of the sample. The proportion of men in both samples was relatively low, which had to do with the fact that their proportion in psychosomatic clinics is low. However, gender correlates very poorly with the attachment scales. A more important reason could be the design of the study, as three age groups were compared, which are close together in age. In previous studies, mostly older test persons were compared with considerably younger persons, which then also led to clearer differences. In the much younger German norming sample of the ECR [34], the average age was 39 years and the values in attachment-related anxiety were significantly higher. It is possible that a certain calming down already takes place in middle age, so that the anxious attachment orientation loses significance. In terms of couple relationships, it could normally be that conflictual disputes, which are common in anxiety-related attachments, decrease with age, beginning in middle age [38]. A hyperactive strategy in long-term partnerships may also ‘grind down’ due to the learning history of regulating conflicts in partnerships or due to the growing ability to manage conflicts with increasing age [39]. With regard to the avoidant attachment orientation, the stronger expression of such an orientation in older cohorts has also been attributed to cohort differences in the past [7]. Restrictive socialisation experienced by these cohorts presumably led to stronger avoidant behaviour, which is possibly less pronounced in the cohorts now moving up. Finally, it could be significant that this, as well as other age phenomena today, occurs later in life, i.e., only in very old age, but that was not included here. This raises questions that should be clarified in future studies, especially in longitudinal studies.
Highly significant differences with large effect sizes are found in both attachment scales between clinical and nonclinical samples. For patients with common mental disorders in the second half of life, an insecure attachment orientation is of great importance, which is shown in both attachment scales, i.e., both an anxious and an avoidant attachment orientation are more pronounced in the clinical sample than in the nonclinical sample. How is this to be understood? Years ago, Bartholomew and Horowitz [23] described, for the first time, an attachment style that shows the pattern found here. With this fear-avoiding attachment style, a fourth attachment style was introduced, in which the attachment system is activated first in threatening situations, i.e., the affected persons have an impulse to turn to others and demand their attention and support in the hope of calming the attachment system. However, they apparently lack the necessary self-confidence or are afraid of rejection, which then causes them to switch to the deactivating strategy of avoiding attachment style [7,40]. Currently, the reported findings suggest that this attachment conflict has special clinical relevance in middle-aged and older patients. On the other hand, in the nonclinical group, significantly lower values were found on both attachment-related scales, indicating a greater degree of attachment security. The multivariate analysis provides some clues to explain the differences between the two groups.
To determine the multivariate connections of attachment orientations with the health-related variables, three linear regression analyses were conducted, for the clinical sample with HEALTH-PSS as criterion and for both samples with HEALTH-WB as criterion. In all three analyses, the variance elucidation was only moderately high, i.e., there are numerous variables not recorded here that also have an influence on the criterion. The results for the first regression analysis show the great importance of attachment-related anxiety with regard to symptom formation in the clinical sample. This is in line with other findings in younger people, for whom this attachment orientation is more strongly related to psychological symptoms [15]. It can be assumed that the activation of attachment behaviour is associated with an increase in stress levels and conflicts with other people, which increases the development of psychological symptoms. Attachment-related avoidance, on the other hand, normally represents relative protection. The regression analysis shows no significant relationship to symptom burden, but the high values in the clinical sample show that in the case of mental illness, this protection is apparently no longer guaranteed. This may also be related to the fact that in the case of stress, avoidantly attached individuals have less access to social support and thus may find it more difficult to cope with this stress [19], or they interpret social support negatively [41]. Nevertheless, an avoidant attachment orientation has less significance for symptom formation than an anxious attachment orientation.
With regard to psychological well-being, separate analyses were conducted for both samples. In some previous studies, avoidantly attached older people displayed as much well-being or life satisfaction as securely attached elders [10,42], others found a negative influence of avoidant attachment orientation on well-being [43], and Condensine and Fiori [10] found a correlation of an avoidant orientation with negative but not with positive emotions. In the results reported here, a correlation between avoidance orientation and reduced well-being is confirmed, but there is no connection between anxious orientation and subjective well-being. In both samples, a stronger avoidant attachment orientation is associated with lower well-being. However, there is an important difference: while in the nonclinical sample the predictor with the largest beta weight is age, i.e., higher age is associated with greater well-being, which is not the case in the clinical sample. The ability to maintain or even improve well-being in old age is considered one of the central aspects of successful ageing. Labouvie-Vief and Medler [44] also saw this as protection against the ‘impositions’ of old age, which can decompensate in stressful situations. This, it can be assumed, has happened in the clinical sample. Older people with common mental disorders are not able to further increase their psychological well-being to protect themselves from the demands of ageing.
There are some limitations of the study, and some have already been pointed out above. It should be noted, for example, that the questionnaire records partnership-related attachment behaviour; whether the findings can be generalised to other attachment relationships must remain open. It has also already been pointed out that the two samples are not differentiated clearly enough. In addition, however, there is the question of the validity of the questionnaire used, or basically the question of whether attachment orientations in older people can be validly recorded with the help of a questionnaire. The difficulties of a number of older people completing the questionnaire have already been mentioned above. In particular, answering inversely formulated questions places considerable demands on cognitive flexibility, which obviously not all older people are able to meet. In addition, the content of the questionnaireis aimed at recording relationship-related attachment behaviour. It is known from gerontological research that older people tend to assess close attachment figures more positively than do other age groups (positivity effect), which is explained by the theory of socioemotional selectivity [13]. This may have led to a positive bias in filling out the questionnaire. Perhaps, therefore, the reported results do not adequately reflect actual age differences.
Clinical Implications
- In emotionally distressed middle-aged and older persons, insecure attachment orientations represent an important dimension with regard to an understanding of the underlying psychodynamics, and the promotion of secure attachment and well-being can be formulated as the overarching therapeutic goal. However, anxious and avoidant attachment orientations have different functions. Reducing anxious attachment orientation serves more to reduce symptoms while reducing avoidant attachment orientation serves more to improve well-being
- Different therapeutic objectives result from the predominant attachment orientation [45,46]. If an anxious attachment orientation is in the foreground, it is about how the patient can achieve greater control over his or her own experience and to improve regulation of affect; if an avoidant attachment is in the foreground, it is about giving greater access to one’s own experience of affect and closeness in relationships as well as accepting support from others [41]
- The results of the evaluation study by Peters et al., show that older patients show equally positive results in symptom improvement and improved well-being after treatment in a psychosomatic clinic as younger patients
Acknowledgement
We would like to thank all the patients who participated in the study for their readiness and engagement as well as their patience and effort. In addition, we would like to thank the staff of the hospital in Bad Hersfeld (Hessen/Germany), who facilitated the assessment and supported data collection.
Statement of Ethics
The study was approved by the independent ethics committee of Philipps-University Marburg/Germany (number AZ1-10-15). All participants completed an informed consent form that included the purpose and circumstances of the study, information regarding data privacy and the right to refuse participation without any consequences, as well as information regarding the right to withdraw from the study during and after data collection.
Disclosure Statement
The authors report no conflicts of interest.
Funding Source
This work was supported by Heidehof-Stiftung, Stuttgart, Germany (Nr. 59065.02.1/2.15).
Data Availability Statement
Data available on request due to privacy/ethical restrictions.
References
- Bowlby J (1973) Attachment and Loss: Volume II: Separation, Anxiety and Anger. Basic Books, New York, USA.
- Bowlby J (1980) Attachment and loss. Vol. 3, Loss: Sadness and depression. Basic Books, New York, USA.
- Bowlby J (1982) Attachment and loss: Retrospect and prospect. American Journal of Orthopsychiatry 52: 664-678.
- Magai C, Frias MT, Shaver PR (2018) Attachment in Middle and Later Life. In: Cassidy J, Shaver PR (eds.). Handbook of Attachment. Theory, Research and Clincical Applications. Guilford Press, New York, USA.
- Van Assche L, Luyten P, Bruffaerts R, Persoons P, van de Ven L, et al. (2013) Attachment in old age: Theoretical assumptions, empirical findings and implications for clinical practice. Clin Psychol Rev 33: 67-81.
- Shaver PR, Mikulincer M (2018) Adult attachment and emotion regulation. In: Cassidy J, Shaver PR (eds.). Handbook of attachment. Theory, Research, and Clinical Applications. Guilford Press, New York, USA.
- Magai C, Hunziker J, Mesias W, Culver LC (2000) Adult attachment styles and emotional biases. International Journal of Behavioral Development 24: 301-309.
- Diehl M, Elnick AB, Bourbeau LS, Labouvie-Vief G (1998) Adult attachment styles: Their relations to family context and personality. J Pers Soc Psychol 74: 1656-1669.
- Magai C, Cohen C, Milburn N, Thorpe B, McPherson R, et al. (2001) Attachment styles in older European American and African American adults. Journal of Gerontology: Social sciences 56: 28-35.
- Consedine NS, Fiori KL (2009) Gender moderates the associations between attachment and discrete emotions in late middle age and later life. Aging Ment Health 13: 847-862.
- Consedine NS, Fiori KL, Magai C (2012) Regulating emotion expression and regulating emotion experience: Divergent associations with dimensions of attachment among older women. Attach Hum Dev 14: 477-500.
- Cicirelli VG (2010) Attachment relationships in old age. Journal of Social and Personal Relationships 27: 191-199.
- Carstensen LL (2006) The Influence of a Sense of Time on Human Development. Science 312: 1913-1915.
- Segal DL, Needham TN, Coolidge FL (2009) Age differences in attachment orientations among younger and older adults: Evidence from two self-report measures of attachment. Int J Aging Hum Dev 69: 119-132.
- Kooiman CG, Klaassens ER, van Heloma Lugt JQ, Kamperman AM (2013) Psychometrics and validity of the Dutch Experiences in Close Relationships-Revised (ECR-r) in an outpatient mental health sample. J Pers Assess 95: 217-224.
- Zhang F, Labouvie-Vief G (2004) Stability and fluctuation in adult attachment style over a 6-year period. Attach Hum Dev 6: 419-437.
- Crowell JA, Fraley RC, Roisman GI (2018) Measurement of Individual Differences in Adult Attachment. In: Cassidy J, Shaver PR (eds.). Handbook of Attachment. Theory, Research and Clincical Applications. Guilford Press, New York, USA.
- Stoval-McClough K, Dozier M (2018) Attachment States of Mind and Psychopathology in Adulthood. In: Cassidy J, Shaver PR (eds.). Handbook of Attachment. Theory, Research, and Clinical Applications. Guilford Press, New York, USA.
- Spence R, Jacobs C, Bifulco A (2018) Attachment style, loneliness and depression in older age women. Aging Ment Health 24: 837-839.
- Van Assche L, Van de Ven L, Vandenbulcke M, Luyten P (2020) Ghosts from the Past? The Association between Childhood interpersonal Trauma, Attachment and Anxiety and Depression in Late Life. Aging Ment Health 24: 898-905.
- Ogle CM, Rubin DC, Siegler IC (2015) The Relation Between Insecure Attachment and Posttraumatic Stress: Early Life Versus Adulthood Traumas. Psychol Trauma 7: 324-332.
- WHO (1997) WHOQOL: Measuring Quality of Life. WHO, Geneva, Switzerland.
- Bartholomew K, Horowitz LM (1991) Attachment styles among young adults: A test of a four-category model. J Pers Soc Psychol 61: 226-244.
- Wensauerm M, Grossmann KE (1998) Bindungstheoretische Grundlagen subjektiver Lebenszufriedenheit und individueller Zukunftsorientierung im höheren Erwachsenenalter. Z Gerontol Geriat 31: 362-370.
- Homan KJ (2018) Secure attachment and eudaimonic well-being in late adulthood: The mediating role of self-compassion. Aging Ment Health 22: 363-370.
- Ryff CD, Radler BT, Friedman EM (2015) Persistent Psychological Well-being Predicts Improved Self-Rated Health Over 9-10 Years: Longitudinal Evidence from MIDUS. Health Psychol Open 2: 2055102915601582.
- Braam AW, Copeland JR, Delespaul PA, Beekman AT, Como A, et al. (2014) Depression, subthreshold depression and comorbid anxiety symptoms in older Europeans: Results from the EURODEP concerted action. J Affect Disord 155: 266-272.
- Beekman AT, Bremmer MA, Deeg DJ, van Balkom AJ, Smit JH, et al. (1998) Anxiety disorders in later life: A report from the longitudinal aging study Amsterdam. Int J Geriatr Psychiatry 13: 717-726.
- Hegeman JM, de Waal MW, Comijs HC, Kok RM, van der Mast RC (2015) Depression in later life: A more somatic presentation?. J Affect Disord 170: 196-202.
- Folstein MF, Folstein SE, McHugh PR (1975) "Mini-mental state". A practical method for grading the cognitive state of patients for the clinician. J Psychiatr Res 12: 189-198.
- Farley RC (2007) Information on the Expericence in Close Relationships - Revised (ECR-R). Adult Attachment Questionnaire.
- Hesse E (2018). The Adult Attachment Interview: Protocol, Method of Analysis and Selected Empirical Studies: 1985-2015 (3rdedn). In: Cassidy J, Shaver PR (eds.). Handbook of Attachment. Theory, Research, and Clinical Applications. The Guilford Press, New York, USA.
- Fraley RC, Heffernan ME, Vicary AM, Brumbaugh CC (2011) The Experiences in Close Relationships-Relationship Structures questionnaire: A method for assessing attachment orientations across relationships. Psychol Assess 23: 615-625.
- Ehrenthal JC, Dinger U, Lamla A, Funken B, Schauenburg H (2009) Evaluation der deutschsprachigen Version des Bindungsfragebogens “Experiences in Close Relationships-Revised” (ECR-RD) (Evaluation of the German Version of the Attachment Questionnaire “Experiences in Close Relationships-Revised”[ECR-RD]). Psychotherapie Psychosomatik Medizinische Psychologie 59: 215-223.
- Sibley CG, Fischer R, Liu JH (2005) Reliability and Validity of the Revised Experiences in Close Relationships (ECR-R) Self-Report Measure of Adult Romantic Attachment. Pers Soc Psychol Bull 31: 1524-1536.
- Rabung S, Harfst T, Kawski S, Koch U, Wittchen H-U, et al. (2009) Psychometrische überprüfung einer verkürzten version der "Hamburger Module zur Erfassung allgemeiner Aspekte psychosozialer Gesundheit für die therapeutische Praxis" (HEALTH-49). Zeitschrift für Psychosomatische Medizin und Psychotherapie 55: 162-179.
- Cohen J (1988) Statistical power analysis for the behavioural sciences. Academic Press, New York, USA.
- Carstensen LL, Gottman JM, Levenson RW (1995) Emotional behavior in long-term marriage. Psychol Aging 10: 140-149.
- Blanchard-Fields F, Stein R, Watson TL (2004) Age Differences in Emotion-Regulation Strategies in Handling Everyday Problems. J Gerontol B Psychol Sci Soc Sci 59: 261-269.
- Consedine NS, Magai C (2003) Attachment and emotion experience in later life: The view from emotions theory. Attach Hum Dev 5: 165-187.
- Collins NL, Feeney BC (2004) Working models of attachment shape perceptions of social support: Evidence from experimental and observational studies. J Pers Soc Psychol 87: 363-383.
- Bodner E, Cohen-Fridel S (2010) Relations between attachment styles, ageism and quality of life in late life. Int Psychogeriatr 22: 1253-1361.
- Li T, Fung HH (2018) How avoidant attachment influences subjective well-being: an investigation about the age and gender differences. Aging Ment Health 18: 4-10.
- Labouvie-Vief G, Medler M (2002) Affect Optimization and Affect Complexity: Modes and Styles of Regulation in Adulthood. Psychol Aging 17: 571-588.
- Sable P (2000) Attachment and Adult Psychotherapy. Jason Aronson, Northvale, USA.
- Wallin DJ (2015) Attachment in Psychotherapy. Guilford Publications, New York, USA.
Citation: Peters M, Schulz H (2022) Attachment Orientation in Older Patients with Common Mental Disorders: A Cross-Sectional Study. J Gerontol Geriatr Med 8: 123.
Copyright: © 2022 Meinolf Peters, et al. This is an open-access article distributed under the terms of the Creative Commons Attribution License, which permits unrestricted use, distribution, and reproduction in any medium, provided the original author and source are credited.