Comparisons of Demographical and Sleep Architecture between OSA Patients with Various Severities and Developing a Simple Prediction Model
*Corresponding Author(s):
Wen-Te LiuSchool Of Respiratory Therapy, Taipei Medical University, Taipei, Taiwan, Research Center For Artificial Intelligence In Medicine, Taipei Medical University, Taipei, Taiwan, Division Of Pulmonary Medicine, Shuang-Ho Hospital, New Taipei City, Taiwan, Sleep Center, Shuang-Ho Hospital, New Taipei City, Taiwan
Tel:+886 970747200,
Email:lion5835@gmail.com
Abstract
Background
Due to changes in dietary habits and demographic structure, obstructive sleep apnea with obesity and aging as risk factors has become an important public health issue. The aim of this study is to investigate the relationships between demographics features as well as sleep characteristics of patients and severity of OSA and using easily available measurements to develop a simple model for rapidly identify OSA patients.
Methods
A retrospective review of the polysomnography records of patients who refer to the Sleep Center of Shuang-Ho Hospital, New Taipei City, Taiwan with a diagnosis of suspected sleep apnea between March 2015 and March 2019. Patients under 20 and over 80 years old were excluded. The demographic and anthropometric data of the patients were recorded, and comparing those parameters between patients with different severity of OSA.
Results: According to AHI assessed by PSG, 6800 patients were divided into four groups as follows: AHI<5: 1223 common snoring (17.99%), 5≤AHI<15: 1341 mild OSA (19.72%), 15≤AHI<30: 1357 moderate OSA (19.96%) and AHI≥30: 2879 severe OSA (42.34%) patients. Bodyweight, waistline, and BMI, as well as heart rate, snoring index, and oxygen desideration-induced arousal, were increased with OSA severity, while the proportion of females was decreased (all p<0.001). In sleep architecture, patients with more severe OSA showed extended duration of Wake after Sleep Onset (WASO), poor sleep efficiency, and also expanded N1 proportion and reduced N2, N3, and REM. The simple prediction model considered only three factors including weight, age, and oxygen saturation showed great accuracy in identifying OSA patients with the cut-off value AHI>5 (AUC 0.901). Predicted AHI value deduced by linear regression showed substantial correlation with PSG-assessed AHI (Pearson correlation coefficient, 0.73), and considerable ability in explanatory (Ratio variance = 53%).
Conclusion
This study revealed the demographic and clinical differences in patients with various OSA severities and using easily available measurements including weight, age, and mean of oxygen saturation during sleep, we can precisely discriminate OSA patients from the common snoring population.
Keywords
Demographical difference; Obstructive Sleep Apnea (OSA); Sleep architecture; Simple prediction model.
INTRODUCTION
Because of the changes in dietary habits and demographic structure, patients with sleep disorders were substantially increased in recent years and becoming an important public health issue in modern society [1,2]. According to an epidemiological investigation, the prevalence of sleep disorder was estimated at 4-24% in males and 2-9% in females within American populations [3]. Among patients with sleep disorders, Obstructive Sleep Apnea (OSA) is a general type characterized as repeated episodes of apnea during sleep, with complete or incomplete upper airway obstruction that often causes blood oxygen desideration and usually ends with brief awakenings from sleep [4]. In addition, one of the obvious symptoms of OSA patients was loud and irregular snoring during sleep [5]. Due to the difference in cranial structure, the prevalence of OSA within Asian populations was expected higher than Euro-Americans [6,7]. The prevalence of OSA showed in Asian studies was greatly varied, ranging from 3.2% to 27% [6-9].
Previous studies revealed the risk factors of OSA, among them, obesity was the main factor [10,11]. The prevalence of OSA was documented as high as 40% in male obese subjects and 81% in severely obese individuals [12,13]. The possible mechanism that obesity effect on OSA may be medicated by reduced ventilator stability result from airway surrounding adipose tissue deposition [10]. In clinical manifestation, sleep duration and quality were decreased associated with the increased body weight and adiposity [14,15]. On the other hand, in spite of the evidence was less direct, OSA may also reciprocally contributing to obesity [16]. Aging was another significant risk factor for OSA [17]. Previous studies showed the prevalence of OSA and snoring were increased with age [18,19]. It probably due to the reduced pharyngeal muscle strength or shifted circadian rhythm [20,21]. A study found a significant reduction in the amount of slow-wave sleep and increases in stage 1 and 2 non-rapid eye movement sleep in the elderly [17]. Other potential risk factors including smoking and alcohol consumption, nasal congestion, as well as estrogen depletion in menopause, and ethnicity were also documented and discussed [22,23]. Besides, air pollution was also documented as a risk factor for OSA [24].
Growing evidence revealed the associations of OSA with high prevalence in mortality and comorbidity [1,25,26]. Adverse medical conditions associated with OSA including hypertension, stroke, congestive heart failure, coronary artery disease, cardiovascular mortality and neurocognitive dysfunction [23]. OSA reciprocal contributing to obesity through sympathetic activation, insulin resistance, elevated angiotensin II and aldosterone levels, oxidative and inflammatory stress, and perhaps by effects on renal function [27]. In addition, with the long-term intermittent hypoxia, OSA adversely affects multiple organs and systems, aggravates cardiovascular diseases, respiratory disease and metabolic dysfunction [28-31]. Therefore, the prevalence of OSA in those patients with critical illness was observed higher than normal, for example, the prevalence of sleep apnea among patients with essential hypertension is over 25% [32,33]. In clinical application, snoring and sleep apnea were taken as potential determinants of cardiovascular and cerebrovascular risk [32]. Moreover, OSA and companion nocturnal hypoxemia were also shown to increase the risk of diabetes and cancer, as well as stroke [34,35]. Not only influence physiological function, but OSA also influences psychological status and cognition impairment, previous studies documented that OSA elevates the risk of dementia [36,37], deteriorate depression [38], thus diminish the academic and work performance [39,40] and quality of life [22]. Sleepness and fatigue caused by poor sleep quality may also increase the occurrence of car accidents [22,41].
OSA was of great importance in view of individual and public health and Polysomnography (PSG) was the golden standard for screening OSA for decades [42]. However, due to the increased awareness of OSA but the insufficient PSG inspection manpower and space, waiting times for hospital-based PSG monitoring are continuously rising [43-45]. There is an urgent need for a prediction model of OSA severity, which is helpful for OSA screening and treatment strategy formulation. In this study, we retrospectively review the PSG record of patients who were admitted to the Sleep Center of Shuang-Ho Hospital between March 2015 and March 2019. Not merely comparing demographic and clinical features between groups with various OSA severities, we plan to explore the risk factor of OSA and built a predictive model.
MATERIALS AND METHODS
Database
The Institutional Review Board of Taipei Medical University approved analyses of our clinical sleep laboratory database without requiring additional consent. The sleep center of Shuang-Ho hospital uses the Remlogic and Noxtunal recording system and follows Taiwan Society of Sleep Medicine (TSSM) practice standards, including regular scoring evaluation of technologists compared to the medical director. All scoring technologists are certified. Subjects inclusion criteria were: Age ≥ 20 years and < 80 years old, and underwent clinical Polysomnography (PSG) in our sleep center between March 2015 and March 2019, without regard to clinical reason.
Data processing and statistics
We retrospectively review the PSG records of 7131 individuals. Subjects without complete records and out of range in age of inclusion criteria were first excluded. A total of 6800 OSA patients were included in the final analyses. Based on the guidance of the American Academy of Sleep Medicine (AASM), patients were designated into one of the following four groups according to AHI assessed by PSG, AHI<5: Common snorer, 5≤AHI<15: Mild OSA, 15≤AHI<30: Moderate OSA and AHI≥30: Severe OSA patients [46]. Comparisons of demographic features including height, weight, BMI, age, neck circumference and waistline are made between various severities, as well as the clinical characteristics obtain by PSG, including total sleep time, sleep efficiency, Wake after Sleep Onset (WASO) period, AHI, RDI, mean and minimum of oxygen saturation, desideration index, heart rate, snoring and respiratory-related limb movement indexes. The distribution normality of each parameter was tested by the Shapiro-Wilks test, and then the Student’s t-test or Mann-Whitney U test was employed according to the data type. Fisher exact test was applied to examine the difference in gender composition between every two populations. We also analyze the sleep architecture and the proportion of sleep posture. Because the sleep stage and posture were presented in proportion, the Kruskal-Wallis test was used for sleep architecture and posture analysis.
Construction and validation processes for prediction models
For distinguishing OSA patients from healthy ones, multivariate logistic regression analysis was used to predict the probability of having OSA from demographic and clinical variables with a step-wise selection procedure. With various cut-off values, we shift AHI into dichotomous data and randomized choice 50% of data of both categories, and then integrated as one dataset for initial model construction. Although the accuracy of the initial prediction model was stunning (AUC=0.9497), considering the clinical applicability, we try to develop a simple one. After applied Principal Component Analysis (PCA) for dimensionality reduction to explore the association between variables, a simple prediction model that included only three variables, including weight, age, and oxygen saturation was developed. The remaining data were used to validate both models. Sensitivity and specificity were calculated, as well as the ROC curve was plotted to evaluate the area under the curve as an index of accuracy. The probability threshold used for the classification of OSA was 0.50. Persons correlation test was used to identify variables that made an important contribution to the variability of AHI. Stepwise multiple linear regressions were used to yield an equation for predict AHI. And we also transfer both predict AHI and PSG-assessed AHI into nominal variables, Persons correlation test, and chi-square test was used to check the similarity of the two variables respectively.
All results were obtained using R software.
RESULTS
Demographic features
Among 6800 patients included in this study, the distribution of patients with various severity was described as follow: Common snorer (AHI<5): 1223 (17.99%), mild OSA (5≤AHI<15): 1341 (19.72%), moderate OSA (15≤AHI<30): 1357 (19.96%), and severe OSA (AHI≥30): 2879 (42.34%) patients according to the criteria issued by AASM. Body height, weight, BMI, neck circumference and waistline were significant increased with the increasing OSA severity revealed by the Kruskal-Wallis test as well as the modified Bonferroni post-hoc test (all p<0.001). For example, the mean body weight was increased from 62.67±11.83 kg in common snorer to 83.62±16.63 kg in patients with severe OSA. Besides, the proportion of female subjects were 57.4%, 35.2%, 27.6%, and 15.4%, significantly decreased with the increasing OSA severity (Fisher exact test: p < 0.001 be-tween every two groups). While common snorer was younger compare to those patients with OSA regardless of the severity (Table 1).
|
Normal |
Mild |
Moderate |
Severe |
p value |
|
|
N |
1223 |
1341 |
1357 |
2879 |
|
|
Height (cm) |
163.26±8.87a |
165.73±9.17b |
166.42±8.87c |
168.14±7.97d |
<0.001 |
|
Weight (kg) |
62.67±11.83a |
69.64±12.8b |
74.96±14.08c |
83.62±16.63d |
<0.001 |
|
BMI |
23.4±3.32a |
25.33±4.77b |
27.02±4.44c |
29.49±5.06d |
<0.001 |
|
Age (yr) |
44.64±13.66a |
49.44±13.53b |
50.61±12.9b |
50.23±12.65b |
<0.001 |
|
Neck circumference (cm) |
34.96±6.35a |
37.16±11.99b |
38.27±5.42c |
40.85±10.09d |
<0.001 |
|
Waistline (cm) |
79.91±11.73a |
87.02±11.34b |
92.51±25.21c |
99.31±12.36d |
<0.001 |
|
Proportion of female |
57.40% |
35.20% |
27.63% |
15.39% |
<0.001 |
Table 1: Demographic features within groups with various OSA severities. The comparisons of height, weight, BMI, age, neck circumference and waistline were conducted by Kruskal-Wallis test and superscript indicate the statistic outcome of pairwise test with Bonferroni correction. Comparisons of proportion of female were conducted by Fisher exact test.
Clinical characteristics
The total sleep time was a bit longer in the patient with OSA comparing to the common snorer, and within the patient with OSA, sleep efficiency was reduced and the duration of Wake After Sleep Onset (WASO) was elongated as severity rosed (Table 2). Sleep architecture analysis revealed the proportion of N2 and N3 was reduced with growing severity; we also observed a significant reduction in the proportion of Rapid Eye Movement (REM) stage in severe OSA patients. Moreover, it mainly compensates by an elevated proportion of the N1 stage. The occurrence of Obstructive Apnea (OA) events in the REM stage and Non-REM stage were both increased as increasing severity, how-ever, the composition ratio (OA event in REM/OA event in N-REM) shifted, it drops from 4.19 in common snorer to 1.11 in patients with severe OSA (Figure 1). The mean of oxygen saturation during sleep decreased with increasing severity and Oxygen Desaturation Index (ODI) which defined as the number of times per hour of sleep that the blood’s oxygen level drop by criteria of at least 4% was highly correlated with AHI (Pearson correlation coefficient: 0.9907, p<0.001). We also notice that the number of apnea, hypopnea as well as desaturation arousal was significantly expanded, while spontaneous arousal slightly declines (Figure 2). Other clinical manifestations including the mean of heart rate, snoring index and frequency of limb movement during sleep were also shown the growing trend as severity increased (Table 2).
|
Normal |
Mild |
Moderate |
Severe |
p value |
||
|
Sleep time (hr) |
5.62±0.6a |
5.7±0.49b |
5.68±0.5b |
5.7±0.54b |
<0.001 |
|
|
Sleep efficiency |
0.76±0.18a |
0.78±0.15b |
0.77±0.16c |
0.75±0.17c |
<0.001 |
|
|
WASO |
58.28±53.2a |
56.19±45.77b |
61.66±48.94c |
67.68±50.68d |
<0.001 |
|
|
Sleep stage |
REM |
12.9±7.3a |
13.3±6.87a |
13.06±7.23a |
11.06±7.12b |
<0.001 |
|
N1 |
9.88±8.08a |
11.59±9.11b |
13.85±10.51c |
20.22±15.03d |
<0.001 |
|
|
N2 |
71.54±12.4a |
70.72±11.58a |
69.47±12.19b |
66.61±15.21c |
<0.001 |
|
|
N3 |
5.67±8.9a |
4.39±7.41b |
3.62±6.92c |
2.11±4.98d |
<0.001 |
|
|
Apnea events |
Apnea in REM |
0.67±2.55a |
4.49±8.77b |
8.66±13.02c |
21.31±23.3d |
<0.001 |
|
Apnea in NREM |
0.16±0.38a |
1.02±1.71a |
3.25±4.6b |
19.18±21.8c |
<0.001 |
|
|
Oxygen saturations |
SaO2 |
97.25±1.1a |
96.41±1.28b |
95.77±1.47c |
94.13±2.75d |
<0.001 |
|
Oxygen Desaturation |
1.77±1.56a |
9.13±3.43b |
20.82±5.47c |
56.74±21.21d |
<0.001 |
|
|
Desaturation Arousal |
0.1±0.21a |
0.57±0.55b |
1.41±1.08c |
5.4±4.81d |
<0.001 |
|
|
Sleep posture |
Ratio of supine |
32.19±16.28a |
32.7±16.37a |
32.42±16.13a |
33.51±15.65a |
0.075 |
|
Other parameters |
Heart rate |
64.3±8.63a |
65.12±9.05b |
65.99±8.74c |
69.25±9.88d |
<0.001 |
|
Snoring index |
100.6±157.08a |
196.56±208.83b |
261.58±226.56c |
288.57±203.19d |
<0.001 |
|
|
RRLM |
0.13±0.25a |
0.79±0.9b |
1.79±1.87c |
6.44±7.35d |
<0.001 |
Table 2: Clinical characteristics of patients with various OSA severities. WASO: Wake after Sleep Onset, REM: Rapid Eye Movement stage, N1: Non-REM stage 1, N2: Non-REM stage 2, N3: Non-REM stage 3, RRLM: Respiratory-Related Limb Movements.
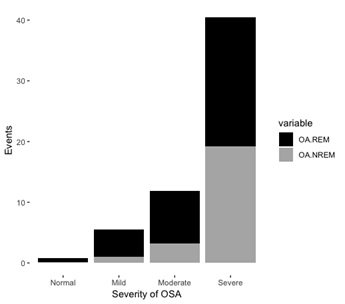 Figure 1: The occurrence of Obstructive Apnea (OA) events in REM stage and Non-REM stage of patients with various OSA severity.
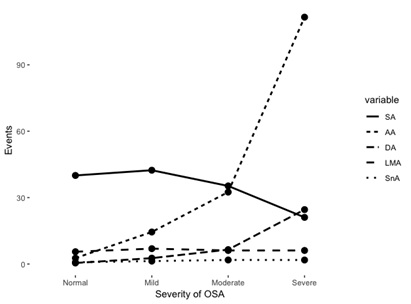 Figure 2: The quantities of various type of arousal events of patients with various OSA severities. SA: Spontaneous Arousal, AA: Apnea and hypopnea Arousal, DA: Desaturation Arousal, LMA: Limb Movement-related Arousal, SnA: Snore Arousal.
Logistic prediction models for discriminating OSA from common snorer
Nine variables including Body height, weight, age, gender, mean heart rate and oxygen saturation during sleep, snoring index, the proportion of supine posture, and total sleep time were significant for our prediction model with cut-off values of AHI
Linear model for predict AHI
We found a direct relationship between AHI and the 14 variables that entered into the simple linear regression model as independent variables. By stepwise selection procedure, all variables except total sleep time were included equation and showed the adjusted R-square of 0.53. The correlation test showed a strong association between predict value and PSG-assessed AHI (Pearson correlation coefficient: 0.7275, p<0.001). We shift both predicted value and PSG-assessed AHI into ordinal variables for evaluating the prediction accuracy. The contingency table presented that our linear model is more accurate in predicting severities in moderate and severe patients, with the accuracy of 0.80 and 0.79, respectively (Table 3).
|
AHI<5 |
5<AHI<15 |
15<AHI<30 |
AHI>30 |
|
|
Predict<5 |
5 |
0.96 |
0.25 |
0.06 |
|
5<Predict<15 |
6.67 |
4.15 |
1.96 |
0.56 |
|
15<Predict<30 |
5.24 |
10.64 |
8.86 |
8.15 |
|
Predict>30 |
1.07 |
3.96 |
8.9 |
33.57 |
Table 3: Proportion of corresponding categories of two ordinal variables (Model predict value and PSG-assessed AHI).
DISCUSSION
Demographical features of subjects were changed as the severity of OSA increased. In agree with previous studies, our study suggested that obesity was the main risk factor for OSA [11,47]. Four indexes, including weight, BMI, neck circumference, and waistline which were all proposed related to obesity, were increased with the severity of OSA. Among these four indicators, BMI was the most commonly used in describing obesity and has been concluded correlated with AHI [48-50]. In a pediatric study, morbidly obese children showed a decrease in sleep efficiency and percentage of time in Rapid Eye Movement (REM) [51]. Because compressed upper airway due to the adipose deposition was considered as one main factor contributing to OSA, neck circumference and its derivatives were used as a surrogate measure of upper airway obesity [52,53]. Neck to Height Ratio (NHR) was another index used to predict AHI for diminishing the gender effect [53]. A recent study discovered Neck-to-Abdominal Fat percentage (NAF %) also associated with OSA severity [54]. However, an investigation showed waistline was more powerful in predict OSA severity [55]. Besides, the association between obesity and OSA can be illustrated from the other aspect. The effect of obesity on OSA was reversible; weight management has been evaluated as a treatment for OSA [47]. Several studies showed the weight loss benefit in improving OSA, as well as reduce daytime sleepiness, as well as metabolic syndrome, and quality of life improvements [56,57]. Unlike the relationship between obesity and OSA, the effect of age in OSA was ambiguous; the prevalence of OSA was increased while severity was reduced [18,19,49,58]. We suspect that it may due to the combination of conflict effect brought by aging; previous studies showed elder people has reduced upper airway muscle strength but they are less obese [49,59,60].
The clinical characteristics advance trend with OSA severity could be discussed from the following three dimensions: Frequent awake during sleep and its cause, shift in sleep architecture and occurrence timing of apnea, and other related physiological distortions. First, in OSA patients, sleep efficiency significantly decreased with increasing OSA severity, while Wake after Sleep Onset (WASO) and the number of arousal events were increased. Furthermore, the number of oxygen desaturation arousal was increased with growing severity besides apnea and hypopnea arousal events. Intermittent hypoxia was one of the remarkable characteristics of OSA patients [61]. Our data revealed that hypoxemia was not only increased in the occurrence frequency but also the duration. Oxygen desaturation index has shown its high degree of correlation with AHI and presented high sensitivity and specificity in the diagnosis of OSA [62,63]. A recent study showed the correlation of sleepness evaluated by Epworth Sleepiness Scale (ESS) with Oxygen De-saturation Index (ODI) was stronger than that with AHI, therefore authors suggested that ODI is as valuable as AHI in diagnosing and grading the OSA [64]. ODI is also associated with the degree of obesity [65]. Moreover, one study showed the association between obesity and sleep duration in older adults [15]. Although the regulatory mechanisms between obesity, oxygen desaturation, and awake still waited for exploration, the evidence clearly showed the associations.
Second, we observed a significant change in sleep architecture between subjects with various OSA severities. As severity increased, the proportion of N2, N3, as well as REM stage, were reduced (REM only significant in severe OSA patients), but compensated with elongated N1 stage. It was agreed with the study focusing on comparing sleep architecture between primary snorer, OSA and normal populations [66], as well as the pediatric study [67,68]. Other studies were using the Markov chain model and transition matrix to demonstrate the alternation in sleep stage transition dynamics, they showed less stability of sleep stage transition in OSA patients [69,70]. The less stability implies more frequent sleep-wake transitions, also known as sleep fragmentation which plays a major role in the pathogenesis of most of the consequences of OSA (i.e. Neuropsychiatric, respiratory and cardiovascular) and may contribute to the progression of OSA severity [71]. Excessive fatigue or sleepiness, waking up tired, falling asleep during the day, trouble in paying attention, snoring and insomnia were confirmed related to decreased N3 sleep [72]. Another key role of sleep was memory consolidation, the decreased N2 and N3, as well as REM stage, may harm spatial memory [73]. Besides, this is the first study that observed a shift in the ratio of REM/Non-REM apnea events. The occurrence timing of apnea events was generally considered mainly in REM, in which the strength of upper airway muscle was lowest compared to other sleep stages [74]. However, the magnification in the occurrence of apnea in Non-REM was outweighing to the increased Non-REM duration and proportion, made the ratio of the probability of apnea occurrence between in REM and Non-REM was nearly equal in severe OSA patients, while the ratio was larger than 4 times in common snorer and mild OSA patients. It could result from both obesity-related neurological and physical distortion. Investigations about the effect of weight loss showed a decreased stage 1 Non-REM as well as elevated sleep efficiency [75,76]. Thus, weight loss was one of the recommended treatments for OSA patients, and effective in im-prove sleep quality as well as benefit to reduce the risk of several critical illnesses [47,57].
Finally, physiological distortion also including snoring index and heart-related illness. Consistent with another study, the snoring index was increased with OSA severity [77]. Individuals with OSA or overweight were presented a narrow airway than the normal population, thus more likely to snore during sleep [78,79]. Obesity is also associated with increased upper airway collapsibility and reduced upper airway muscle protective force [80], that contributing on snore. However, data showed that one-third in male and one-half in female moderate to severe OSA patients were considered snore-free, those patients often ignored by the physician (unpublished data). On the other hand, the Heart Rate (HR) pattern was also influenced by OSA in both short and long terms. In short term, cumulative carbon dioxide speed the HR when an apnea event occurred, and in long term, intermittent hypoxia activates the sympathetic nervous system, thus accelerate the HR and expanded Heart Rate Variability (HRV) [81,82]. HRV was showed associated with severity in pediatric OSA patients [83].
Due to the awareness of sleep disorders has increased but the amplification in the number of beds providing for sleep inspection was not synchronized, waiting times for hospital-based PSG monitoring are successively increased [43-45]. In practice, a prolonged waiting time of hospital-based PSG can delay treatment and deter patients from complying with the sleep study and subsequent treatment [84]. It is obvious of the urgent needs in portable sleep screening devices and simple prediction model, which can save time and cost in individual, hospital and department of insurance than traditional hospital-based PSG inspection [85]. It also provides objective references to medical care personnel for prioritizing the order in which patients with suspected OSA were referred for PSG. By means of the development and certification of the portable device during the decades, the mean oxygen saturation could be measured by Photoplethysmography (PPG) as well as the posture during and limb movement scenario could be detected by the three-dimensional accelerometer, both were relatively easily available comparing to Electroencephalography (EEG), Electrooculogram (EOG) and other sleep-related parameters [86,87]. In 2007, AASM also agree to diagnosis by certificated type 3 portable sleep monitoring devices [88]. Generally believed that the home sleep test was closer to the real scenario. Through patch-free, wireless portable sleep monitoring devices, our team has demonstrated the overestimation of hospital-based PSG (article in press).
Respond to the needs, the development of OSA prediction models was growing vigorously since the last century. Australia and USA researchers proposed that craniofacial photographic analysis pro-vides detailed anatomical data useful in the prediction of OSA [89,90]. One research team in the USA using physiological traits and showed good sensitivity and specificity for predicting OSA [91]. Another USA research team indicated that age, sex, BMI, and medical history are superior to the symptom variables [92]. Mexico re-searchers evaluated the diagnostic value of the morphometric model and the Sleep Apnea Clinical Score [93] and United Kingdom scholars assessed the contribution of the STOP-BANG questionnaire [94]. In recent years, researchers focusing on integrated multidisciplinary variables, Korean team using clinical, anthropometric and cephalometric variables to predicting OSA [95], while Iran researchers using anthropometric and Mallampati indices [96] and Hong-Kong researchers using McGill scores together with overnight oximetry [97]. Here, we developed two models, one with 9 variables including clinical and anthropometric measurements, showed great accuracy and another one, surprisingly, simply consider only three variable including weight, age, and oxygen saturation which are available easily by the wearable device and showed high discrimination ability in identifying OSA patient. However, Singapore researchers found that the prediction model for OSA derived from a foreign population exhibits markedly different diagnostic characteristics from one that is developed locally, thus they underlined the importance of local clinical prediction models [98]. USA research team comparing four prediction models which developed in different cities but all using only clinical variables, the accuracy was varied and not sufficient to discriminate between patients with or without OSA [99]. Thus, the next step will be targeting to evaluate the accuracy between different clinical environments, for example, cross-departments or hospitals. Not only discriminating OSA patients from common snorer, models also predict the OSA severity. A research team in Finland predicts AHI by nasal resistance and change in mandibular position on lying down besides BMI [100]. Spanish researchers using anthropometric, clinical, and epidemiological parameters predict AHI, and the ratio variance in the number of respiratory events explained by the model was 33% [101]. Our linear model presented higher ability in explanation and categorization, especially for moderate and severe OSA patients.
CONCLUSION
In view of the association of many critical illnesses and risk of cognition impairment, OSA is becoming a global public health concern. We here retrospective reviewed the PSG records over the past 4 years of sleep center in Shuang-Ho hospital (New Taipei City) and found the severity of OSA was mainly associated with the degree of obesity. Clinical characteristics including sleep efficiency, sleep architecture, oxygen saturation and heart rate were all fluctuated with a tendency following by the increase of OSA severities. Considering the reality and convenience of data measurement, and future clinical applicability, we develop a simple prediction model that considered merely three easy available variables. It showed high discriminative ability and could apply in the extensive clinical field in saving medical cost and time, programming precisely treatment strategy in time as well as contributing to prioritizing the suspected OSA patients to refer for PSG.
ACKNOWLEDGMENT
This work was supported by the Taiwan Ministry of Science and Technology [MOST 108-2634-F-038-003]. We thank Hsin-Chien Lee, Ying-Shuo Hsu and Cheng-Rong Wu for their comments on sleep medicine and all technicians at the Sleep Center, Shuang-Ho Hospital, for their contribution to data collection and processing.
FOOTNOTE
We present the foregoing article in accordance with the STROBE reporting checklist. The authors are accountable for all aspects of the work in ensuring that questions related to the accuracy or integrity of any part of the work are appropriately investigated and resolved.
DATA AVAILABILITY STATEMENT
The datasets generated during the current study are not publicly available due to involving the privacy of research participants but are available from the corresponding author on reasonable request.
ETHICAL STATEMENT
The authors are accountable for all aspects of the work in ensuring that questions related to the accuracy or integrity of any part of the work are appropriately investigated and resolved. The study was conducted in accordance with the Declaration of Helsinki (as revised in 2013). The study was approved by the Joint Institutional Review Board of Taipei Medical University (TMU-JIRB: N201911007) and individual consent for this retrospective analysis was waived.
CLINICAL TRIAL REGISTRATION NUMBER
The Joint Institutional Review Board of Taipei Medical University approved analyses of clinical sleep laboratory database without requiring additional consent (TMU-JIRB: N201911007).
AUTHOR CONTRIBUTIONS
Wen-Te Liu conceived of the presented idea. Cheng-Yu Tsai and Shang-Yang Lin developed the theory and performed the computations. All authors discussed the results and contributed to the final manuscript. All authors certify that this material or similar material has not been submitted to or published in any other publication yet.
- • Conception and design: Wen-Te Liu
- • Administrative support: Shang-Yang Lin
- • Provision of study materials or patients: Wen-Te Liu, Shang-Yang Lin
- • Collection and assembly of data: All authors
- • Data analysis and interpretation: Shang-Yang Lin, Cheng-Yu Tsai
- • Manuscript writing: All authors
- • Final approval of manuscript: All authors
SOURCE OF SUPPORT
This study was supported by the Taiwan Ministry of Science and Technology (MOST 108-2634-F-038-003).
CONFLICTS OF INTEREST
All authors declare that there is no conflict of interest regarding the publication of this article.
REFERENCES
- Peppard PE, Young T, Barnet JH, Palta M, Hagen EW, et al. (2013) Increased prevalence of sleep-disordered breathing in adults. Am J Epidemiol 177: 1006-1014.
- McNicholas WT, Luo Y, Zhong H (2015) Sleep apnoea: A major and under-recognised public health concern. J Thorac Dis 7: 1269-1272.
- Young T, Palta M, Dempsey J, Skatrud J, Weber S, et al. (1993) The occurrence of sleep-disordered breathing among middle-aged adults. N Engl J Med 328: 1230-1235.
- Sateia MJ (2014) International classification of sleep disorders-third edition: Highlights and modifications. Chest 146: 1387-1394.
- Peter JH, Amend G, Faust M, Meinzer K, Penzel T, et al. (1989) Snoring and sleep apnea syndrome. Wien Med Wochenschr 139: 264-273.
- Puvanendran K and Goh KL (1999) From snoring to sleep apnea in a Singapore population. Sleep Res Online 2: 11-14.
- Kim J, Kim JH, You S, Kang K, Shim J, et al. (2004) Prevalence of sleep-disordered breathing in middle-aged Korean men and women. Am J Respir Crit Care Med 170: 1108-1113.
- Sharma SK, kumpawat S, Banga A, Goel A (2006) Prevalence and risk factors of obstructive sleep apnea syndrome in a population of Delhi, India. Chest 130: 149-156.
- Asaoka S, Namba K, Tsuiki S, Komada Y, Inoue Y, et al. (2010) Excessive daytime sleepiness among Japanese public transportation drivers engaged in shiftwork. J Occup Environ Med 52: 813-818.
- Carter R, Watenpaugh DE (2008) Obesity and obstructive sleep apnea: Or is it OSA and obesity? Pathophysiology 15: 71-77.
- Jehan S, ZI F, Pandi-Perumal SR, Wall S, Auguste E, et al. (2017) Obstructive Sleep Apnea and Obesity: Implications for Public Health. Sleep Med Disord 1: 00019.
- Vgontzas AN, Tan Tl, Bixler EO, Martin LF, Shubert D, et al. (1994) Sleep apnea and sleep disruption in obese patients. Arch Intern Med 154: 1705-1711.
- Polotsky VY, Patil SP, Savransky V, Alison L, Fonti S, et al. (2009) Obstructive sleep apnea, insulin resistance, and steatohepatitis in severe obesity. Am J Respir Crit Care Med 179: 228-234.
- López-García E, Faubel R, Leon-Munoz L, Zuluaga MC, Banegas JR, et al. (2008) Sleep duration, general and abdominal obesity, and weight change among the older adult population of Spain. Am J Clin Nutr 87: 310-316.
- Patel SR, Blackwell T, Redline S, Ancoli-Israel S, Cauley JA, et al. (2008) The association between sleep duration and obesity in older adults. Int J Obes (Lond). 32: 1825-1834.
- Ong CW, Driscoll DM, Truby H, Naughton MT, Hamilton GS, et al. (2013) The reciprocal interaction between obesity and obstructive sleep apnoea. Sleep Med Rev 17: 123-131.
- Edwards BA, Driscoll DM, Ali A, Jordon AS, Trinder J, et al. (2010) Aging and sleep: Physiology and pathophysiology. Semin Respir Crit Care Med 31: 618-633.
- Bixler EO, Vgontzas AN, Have TT, Tyson K, kales A, et al. (1998) Effects of age on sleep apnea in men: I. Prevalence and severity. Am J Respir Crit Care Med 157: 144-148.
- Durán J, Esnaola S, Rubio R, Iztueta A (2001) Obstructive sleep apnea-hypopnea and related clinical features in a population-based sample of subjects aged 30 to 70 yr. Am J Respir Crit Care Med 163: 685-689.
- Huang YL, Liu RY, Wang QS, Someren JWV, Xu H, et al. (2002) Age-associated difference in circadian sleep-wake and rest-activity rhythms. Physiol Behav 76: 597-603.
- Schwartz AR, Patil SP, Schneider H, Smith PL (2008) Modelling pathogenic mechanisms of upper airway dysfunction in the molecular age. Eur Respir J 32: 255-258.
- Young T, Peppard PE, Gottileb DJ (2002) Epidemiology of obstructive sleep apnea: A population health perspective. Am J Respir Crit Care Med 65: 1217-1239.
- Lee W, Nagubadi S, Kryger MH, Mokhlesi B (2008) Epidemiology of Obstructive Sleep Apnea: A Population-based Perspective. Expert Rev Respir Med 2: 349-364.
- Shen YL, Liu WT, Lee KY, Chuang HC, Chen HW, et al. (2018) Association of PM 2.5 with sleep-disordered breathing from a population-based study in Northern Taiwan urban areas. Environ Pollut 233: 109-113.
- Franklin KA, Lindberg E (2015) Obstructive sleep apnea is a common disorder in the population-a review on the epidemiology of sleep apnea. J Thorac Dis 7: 1311-1322.
- Bonsignore MR, Baiamonte P, Mazzuca E, Castrogiovanni A, Marrone O, et al. (2019) Obstructive sleep apnea and comorbidities: A dangerous liaison. Multidiscip Respir Med 14: 8-10.
- Wolk R (2003) Obesity, sleep apnea, and hypertension. Hypertension 42: 1067-1074.
- Parish JM, Somers VK (2004) Obstructive sleep apnea and cardiovascular disease. Mayo Clin Proc 79: 1036-1046.
- Jean-Louis G, ZI F, Clark LT, Brown CD, McFarlane SI (2008) Obstructive sleep apnea and cardiovascular disease: Role of the metabolic syndrome and its components. J Clin Sleep Med 4: 261-272.
- Lopez-Jimenez F (2008) Obstructive sleep apnea: Implications for cardiac and vascular disease. Chest 133: 793-804.
- Owens RL, Malhotra A (2010) Sleep-disordered breathing and COPD: The overlap syndrome. Respir Care 55: 1333-1346.
- Partinen M, Telakivi T (1992) Epidemiology of obstructive sleep apnea syndrome. Sleep 15: 1-4.
- Partinen M (1995) Epidemiology of obstructive sleep apnea syndrome. Curr Opin Pulm Med 1: 482-487.
- Garvey JF, Pengo MF, Drakatos P, Kent BD (2015) Epidemiological aspects of obstructive sleep apnea. J Thorac Dis 7: 920-929.
- Mohsenin V (2001) Sleep-related breathing disorders and risk of stroke. Stroke 32: 1271-1278.
- Bliwise DL (1993) Sleep in normal aging and dementia. Sleep 6: 40-81.
- Bu XL, Liu YH, Wang QH, Jiao SS, Zeng F, et al. (2015) Serum amyloid-beta levels are increased in patients with obstructive sleep apnea syndrome. Sci Rep 5: 13917.
- Nutt D, Wilson S, Paterson L (2008) Sleep disorders as core symptoms of depression. Dialogues Clin Neurosci 10: 329-336.
- Pati AK, Parganiha A, Reinberg A (2001) Shift work: Consequences and management. Current Science 81: 35-52.
- Abdulghani HM, Alrowais NA, Saad NSB, Subaie NMA, Haji AMA, et al. (2012) Sleep disorder among medical students: Relationship to their academic performance. Med Teach 34: 37-41.
- Engleman HM, Jirhandeh NA, McLeod AL, Ramsay CF, Deary IJ, et al. (1996) Self-reported use of CPAP and benefits of CPAP therapy: A patient survey. Chest 109: 1470-1476.
- Kryger M, Roth T, Dement W (2017) Principles and practice of sleep medicine. Elsevier, Amsterdam, Netherlands.
- Flemons WW, Douglas NJ, Kuna ST, Rodenstein DO, Wheatley J (2004) Access to diagnosis and treatment of patients with suspected sleep apnea. Am J Respir Crit Care Med 169: 668-672.
- Rotenberg B, George C, Sullivan K, Wong E (2010) Wait times for sleep apnea care in Ontario: A multidisciplinary assessment. Can Respir J 17: 170-174.
- Povitz M, Jenkyn KB, Kendzerska T, Allen B, Pendharkar SR, et al. (2019) Clinical pathways and wait times for OSA care in Ontario, Canada: A population cohort study. Can J Respir Crit Care Sleep Med 3: 91-99.
- Kapur VK, Auckley DH, Chowdhuri S, Kuhlmann DC, Mehra R, et al. (2017) Clinical practice guideline for diagnostic testing for adult obstructive sleep apnea: An american academy of sleep medicine clinical practice guideline. J Clin Sleep Med 13: 479-504.
- Cowan DC, Livingston E (2012) Obstructive sleep apnoea syndrome and weight loss: Review. Sleep Disord 2012: 163296.
- Ogretmenoglu O, Süslü AE, Yücel OT, Onerci TM, Sahin A (2005) Body fat composition: A predictive factor for obstructive sleep apnea. Laryngoscope 115: 1493-1498.
- Gao H, Nian HL, Xia XQ, Qing CY (2006) Correlation of sleep apnea syndrome with the age and body weight: A report of 116 cases. Journal of Bengbu Medical College 2006-03.
- Kang KT, Lee PL, Weng WC, Hsu WC (2012) Body weight status and obstructive sleep apnea in children. Int J Obes (Lond) 36: 920-924.
- Scott B, Johnson RF, Mitchell RB (2016) Obstructive sleep apnea: Differences between normal-weight, overweight, obese, and morbidly obese children. Otolaryngol Head Neck Surg 154: 936-943.
- Horner RL, Mohiaddin RH, Lowell DG, Shea SA, Burman ED, et al. (1989) Sites and sizes of fat deposits around the pharynx in obese patients with obstructive sleep apnoea and weight matched controls. Eur Respir J 2: 613-622.
- Dancey DR, Hanly PJ, Soong C, Lee B, Shepard J, et al. (2003) Gender differences in sleep apnea: The role of neck circumference. Chest 123: 1544-1550.
- Glicksman A, Hadjiyannakis S, Barrowman N, Walker S, Hoey L, et al. (2017) Body fat distribution ratios and obstructive sleep apnea severity in youth with obesity. J Clin Sleep Med 13: 545-550.
- Lovin S, Bercea R, Cojocaru C, Rusu G, Mihaescu T (2010) Body composition in obstructive sleep apneahypopnea syndrome bio-impedance reflects the severity of sleep apnea. Multidiscip Respir Med 5: 44-49.
- Loube DI, Loube AA, Erman MK (1997) Continuous positive airway pressure treatment results in weight less in obese and overweight patients with obstructive sleep apnea. J Am Diet Assoc 97: 896-897.
- Dixon JB, Schachter LM, O'Brien PE (2005) Polysomnography before and after weight loss in obese patients with severe sleep apnea. Int J Obes (Lond) 29: 1048-1054.
- Han XM, Yao WZ, Wang YZ, Ren B, Lin YP (2007) The correlation between age, body mass index and obstructive sleep apnea hypopnea syndrome. Hainan Medical Journa l18: 22-24.
- Behan M, Brownfield MS (1999) Age-related changes in serotonin in the hypoglossal nucleus of rat: Implications for sleep-disordered breathing. Neurosci Lett 267: 133-136.
- Marcus CL, Lutz J, Hamer A, Smith PL, Schwartz A (1999) Developmental changes in response to subatmospheric pressure loading of the upper airway. J Appl Physiol 87: 626-633.
- Lavie L (2015) Oxidative stress in obstructive sleep apnea and intermittent hypoxia--revisited--the bad ugly and good: Implications to the heart and brain. Sleep Med Rev 20: 27-45.
- del Campo F, Hornero R, Zamarrón C, Abasolo DE, Alvarez D (2006) Oxygen saturation regularity analysis in the diagnosis of obstructive sleep apnea. Artif Intell Med 37: 111-118.
- Ernst G, Bosio M, X Salvado V, Dibur E, Nigro C, et al. (2016) Difference between Apnea-Hypopnea Index (AHI) and Oxygen Desaturation Index (ODI): Proportional increase associated with degree of obesity. Sleep Breath 20: 1175-1183.
- Temirbekov D, Günes S, Yazici ZM, Sayin I (2018) The ignored parameter in the diagnosis of obstructive sleep apnea syndrome: The oxygen desaturation index. Turk Arch Otorhinolaryngo l56: 1-6.
- Peppard PE Ward NR, Morrell MJ (2009) The impact of obesity on oxygen desaturation during sleep-disordered breathing. Am J Respir Crit Care Med 180: 788-793.
- Shahveisi K, Jalali A, Moloudi MR, Moradi S, Maroufi A, et al. (2018) Sleep architecture in patients with primary snoring and obstructive sleep apnea. Basic Clin Neurosci 9: 147-156.
- Zhu Y, Au CT, Lam HS, Chan CCK, Ho C, et al. (2014) Sleep architecture in school-aged children with primary snoring. Sleep Med 15: 303-308.
- Durdik P, Sujanska A, Suroviakova S, Evangelisti M, Banovcin P, et al. (2018) Sleep architecture in children with common phenotype of obstructive sleep apnea. J Clin Sleep Med 14: 9-14.
- Kim JW, Lee JS, Robinson PA, Jeong DU (2009) Markov analysis of sleep dynamics. Phys Rev Lett 102: 178104.
- Bizzotto R, Zamuner S, Nicolao GD, Karlsson MO, Gomeni R (2010) Multinomial logistic estimation of Markov-chain models for modeling sleep architecture in primary insomnia patients. J Pharmacokinet Pharmacodyn 37: 137-155.
- Kimoff RJ (1996) Sleep fragmentation in obstructive sleep apnea. Sleep 9: 61-66.
- Basunia M, Fahmy SA, Schmidt F, Agu C, Bhattarai B, et al. (2016) Relationship of symptoms with sleep-stage abnormalities in obstructive sleep apnea-hypopnea syndrome. J Community Hosp Intern Med Perspect 6: 32170.
- Xia L, Chen GH, Wei QG, Ge YJ, Kong XY, et al. (2018) Discrepancies of cognition among different subtypes and correlations with sleep parameters in the patients with chronic insomnia disorder. Neuropsychiatry 8: 570-579.
- Goh DY, Galster P, Marcus CL (2000) Sleep architecture and respiratory disturbances in children with obstructive sleep apnea. Am J Respir Crit Care Med 162: 682-686.
- Smith PL, Gold AR, Meyers, DA Haponik EF, Bleecker ER (1985) Weight loss in mildly to moderately obese patients with obstructive sleep apnea. Ann Intern Med 103: 850-855.
- Kalra M, Mannaa M, Fitz K, Kumar S, Chakraborty R, et al. (2008) Effect of surgical weight loss on sleep architecture in adolescents with severe obesity. Obes Surg 18: 675-679.
- Wu HT, Pan WY, Liu AB, Su MC, Chen HR, et al. (2016) Vibration signals of snoring as a simple severity predictor for obstructive sleep apnea. Clin Respir J 10: 440-448.
- Ryan CF, Dickson RI, Lowe AA, Blokmanis A, Fleetham JA (1990) Upper airway measurements predict response to uvulopalatopharyngoplasty in obstructive sleep apnea. Laryngoscope 100: 248-253.
- Fleetham JA (1992) Upper airway imaging in relation to obstructive sleep apnea. Clin Chest Med 13: 399-416.
- Pillar G, Shehadeh N (2008) Abdominal fat and sleep apnea: The chicken or the egg? Diabetes Care 31: 303-309.
- Nazeran H, Pamula Y, Behbehani K (2006) Heart Rate Variability (HRV): Sleep disordered breathing. Wiley Encyclopedia of Biomedical Engineering.
- Kim MS, Cho YC, Seo ST, Son CS, Kim YN (2012) Comparison of Heart Rate Variability (HRV) and nasal pressure in Obstructive Sleep Apnea (OSA) patients during sleep apnea. Measurement 45: 993-1000.
- Aljadeff G, Gozal D, Schechtman VL, Burrell B, Harper RM, et al. (1997) Heart rate variability in children with obstructive sleep apnea. Sleep 20: 151-157.
- Chiao W, Durr ML (2017) Trends in sleep studies performed for Medicare beneficiaries. Laryngoscope 127: 2891-2896.
- Dingli K, Coleman EL, Vennelle M, Finch SP, Wraith PK, et al. (2003) Evaluation of a portable device for diagnosing the sleep apnoea/hypopnoea syndrome. Eur Respir J 21: 253-259.
- Abay TY, Kyriacou PA (2018) Photoplethysmography for blood volumes and oxygenation changes during intermittent vascular occlusions. J Clin Monit Comput 32: 447-455.
- Walmsley CP, Williams SA, Grisbrook T, Elliott C, Imms C, et al. (2018) Measurement of upper limb range of motion using wearable sensors: A systematic review. Sports Med Open 4: 53.
- Collop NA, Anderson WM, Boehlecke B, Claman D, Goldberg R, et al. (2007) Clinical guidelines for the use of unattended portable monitors in the diagnosis of obstructive sleep apnea in adult patients. Portable Monitoring Task Force of the American Academy of Sleep Medicine. J Clin Sleep Med 3: 737-747.
- Kushida CA, Efron B, Guilleminault C (1997) A predictive morphometric model for the obstructive sleep apnea syndrome. Ann Intern Med 127: 581-587.
- Lee RW, Petocz P, Prvan T, Chan ASL, Grunstein RR, et al. (2009) Prediction of obstructive sleep apnea with craniofacial photographic analysis. Sleep 32: 46-52.
- Owens RL, Edwards BA, Eckert DJ, Jordan AS, Sands SA, et al. (2015) An integrative model of physiological traits can be used to predict obstructive sleep apnea and response to non-positive airway pressure therapy. Sleep 38: 961-970.
- Ustun B, Westover MB, Rudin C, Bianchi MT (2016) Clinical prediction models for sleep apnea: The importance of medical history over symptoms. J Clin Sleep Med 12: 161-168.
- Castorena-Maldonado A, Espinosa-Morett L, Bosque FAD, Carrillo-Alduenda JL, Torre-Bouscoulet L, et al. (2015) Diagnostic value of the morphometric model and adjusted neck circumference in adults with obstructive sleep apnea syndrome. Rev Invest Clin 67: 258-265.
- Cowan DC, Allardice G, MacFarlane D, Ramsay D, Ambler H, et al. (2014) Predicting sleep disordered breathing in outpatients with suspected OSA. BMJ Open 4: 004519.
- Kim ST, Park KH, Shin SH, Kim JE, Pae CU, Ko KP, et al. (2017) Formula for predicting OSA and the Apnea-Hypopnea Index in Koreans with suspected OSA using clinical, anthropometric and cephalometric variables. Sleep Breath 21: 885-892.
- Amra B, Pirpiran M, Soltaninejad F, Penzel T, Fietze I, et al. (2019) The prediction of obstructive sleep apnea severity based on anthropometric and Mallampati indices. J Res Med Sci 24: 66.
- Chan WS, Chan EYT, Ng DKK, Kwok KL, Yip AYF, et al. (2019) McGill oximetry score to predict risk of obstructive sleep apnea in pediatric patients. Pediatr Respirol Crit Care Med 3: 36-39.
- Khoo SM, Poh HK, Chan YH, Ngerng WJ, Shi DX, et al. (2011) Diagnostic characteristics of clinical prediction models for obstructive sleep apnea in different clinic populations. Sleep Breath 15: 431-437.
- Rowley JA, Aboussouan LS, Badr MS (2000) The use of clinical prediction formulas in the evaluation of obstructive sleep apnea. Sleep 23: 929-938.
- Virkkula P, Hurmerinta K, Löytönen M, Salmi T, Malmberg H, et al. (2009) Postural cephalometric analysis and nasal resistance in sleep?disordered breathing. Laryngoscope 113: 1166-1174.
- Montoya FS, Bedialauneta JRI, Larracoechea UA, Ibargüen AM, Rey ASD, et al. (2007) The predictive value of clinical and epidemiological parameters in the identification of patients with Obstructive Sleep Apnoea (OSA): A clinical prediction algorithm in the evaluation of OSA. Eur Arch Otorhinolaryngology 264: 637-643.
Citation: Lin SY, Tsai CY, Liu WT (2020) Comparisons of Demographical and Sleep Architecture between OSA Patients with Various Severities and Developing a Simple Prediction Model. J Pulm Med Respir Res 6: 052.
Copyright: © 2020 Shang-Yang Lin, et al. This is an open-access article distributed under the terms of the Creative Commons Attribution License, which permits unrestricted use, distribution, and reproduction in any medium, provided the original author and source are credited.