Correlation-between-Virulence-Genes-Profile-of-Currently-Circulating-E-coli-Pathotypes
*Corresponding Author(s):
Selim S SalamaCentral Laboratory For Evaluation Of Veterinary Biologics Clevb, Cairo, Egypt
Tel:+20 1066655085,
Email:selimsalama2000@yahoo.com
Abstract
Introduction
Diseases causing diarrhea are one of the major causes of deaths in low and middle income countries and responsible for high mortality rate in young calves resulting in economic losses. Several studies concluded to the high distribution of Escherichia coli (E. coli) strains in infectious calf diarrhea. STEC causes human gastrointestinal illnesses with diverse clinical spectra. So this study was planned for isolation, identification and molecular characterization of the currently circulating E. coli between calves and related workers in Egypt and to determine the role of virulence genes and pathotypes of E. coli in diarrhea in both calves and humans.
Material and methods
A total of 161 Holsteins calves with varying ages in four different farms in Egypt were examined clinically for diarrhea as well as related human workers in these farms. 43 fresh fecal samples were collected from diarrheic calves as well as 18 stool swab samples from workers then transferred to microbiological laboratory for bacteriological and molecular examination.
Results
The prevalence rate of E. coli was 53% among diarrheic calf samples and the highest isolation rate was 77% among Group I (age <month) and decreased with age. Meanwhile isolation rate in human samples was 50% (9 out of 18). Regarding virulence genes, VT1, VT2 and eaeA virulence gens were successfully amplified in 1, 7 and 7 out of 23 calf isolates respectively. On the other hand human isolates showed only positive reaction with VT1 and VT2 were recovered from 5 and 4 out of 9 isolates while eaeA gave no positive reaction.
Conclusion
Depending on the virulence gene profiling of E. coli isolates, there was 8 out 23 animal isolates were Shiga Toxin producing E. coli (STEC) representing 35% of total animal isolates and 7 out of 23 animal isolates were Enteropathogenic E. coli (EPEC)representing 30% of total animal isolates. Meanwhile, 100% of the human isolates were STEC.
Keywords
Calf diarrhea; E. coli; Human diarrhea; Virulence genes
INTRODUCTION
STEC is an enteric pathogen that has been linked to outbreaks from foodborne, waterborne and contact sources. STEC causes human gastrointestinal illnesses with diverse clinical spectra, ranging from watery and bloody diarrhea to hemorrhagic colitis. It may also cause hemolytic-uremic syndrome and renal failure [7,8]. Rapid detection of Shiga Toxin-producing Escherichia Coli (STEC) enables appropriate treatment. In the same time the non-O157H7 STEC serotypes have increased significantly in the past decade that not ferment sorbitol making it difficult to be detected by conventional methods [9]. Molecular detection of Virulence genes (VT1, VT2 and eaeA) accelerates more sensitive and accurate detection in comparison with traditional methods [10]. So this study was planned for isolation, identification and molecular characterization of currently circulating E-coli between diarrhic calves and contact workers to determine the role of virulence genes and pathotypes in diarrhea in both calves and humans.
MATERIALS AND METHODS
Ethics statement
The collection of feces samples had been approved by the owner of the farm. Conduct animal experiments in accordance with laboratory regulations. This study was approved by the Ethics Committee of the New Valley University.
Study design
A cross-sectional study was carried out to investigate the prevalence of E. coli causing diarrhea in calves and humans by isolation, identification and molecular study and comparison of virulence genes.
Study animals
A total of 161 Holsteins calves with varying ages in four different farms in Egypt were examined clinically for diarrhea as well as all human workers in these farms. The calves were divided into three groups according to their age. Group I aged from 1 day to 1 month including 60 calves (20 clinical samples were collected from farm 1, 8 from farm 2, 15 from farm 3 and 17 clinical samples were collected from farm 4), Group II aged more than 1 month up to 3 month including 55 calves (8 clinical samples were collected from farm 1, 4 from farm 2, 16 from farm 3 and 27 clinical samples were collected from farm 4) meanwhile Group III aged more than 3 month up to 6 month including 46 calves (4 clinical samples were collected from farm 1, 5 from farm 2, 11 from farm 3 and 26 clinical samples were collected from farm 4).
Collection of samples
A total number of 43 fresh fecal samples were collected directly under aseptic condition from the rectum of 43 diarrheic calves (out of 161clinicaly examined calves) suffer from diarrhea which ranged from pasty to watery feces, varying degree of dehydration, off food and weakness (Figure 1) using sterile rectal swabs and 18 stool swab samples from workers [11]. Samples were properly identified and kept in sterilized containers and preserved on ice, transferred to the microbiology Laboratory in The Central Laboratory for Evaluation of Veterinary Biologics (CLEVB) in Abbassia, Cairo for bacteriological examination and molecular examination.
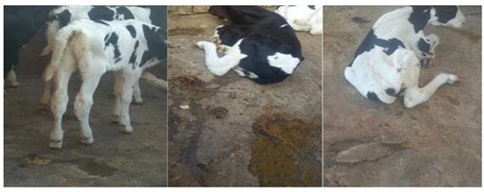 Figure 1: Showed clinical signs and diarrhea in suffered calves.
Isolation and identification of coli
Colonial morphology
All samples were diluted in phosphate buffered saline to be cultured on MacConkey agar (Oxoid; CM0115) and Eosin methylene blue (oxide; CM 69) and incubated at 37°C for 18 - 24hrs for primary isolation of E. coli.
Microscopic examination
Smears from freshly growing suspected colonies were stained with Gram stain and examined microscopically.
Motility
Motility was assured by growing and spreading of the pure colonies by stabbing in semisolid agar.
Biochemical identification
Pure cultures were examined biochemically by using API 20E identification system according to [12] following the procedures of kit manual.
Genotypic identification
DNA extraction
DNA templates were prepared using Isolate PrestoTM Mini gDNA Bacteria kit (Geneaid cat# GBB101).
Primer used
Specific primer for 16s rRNA gene, (Table 1), was used for molecular identification of E. coli isolates.
|
Genes |
Primer Sequence |
Product |
Reference |
|
16s rRNA |
F5-GACCTCGGTTTAGTTCACAGA-3 |
585 bp |
Tonu et al., [13] |
|
R5-CACACGCTGACGCTGACCA-3 |
|||
|
VT1 |
F5-CGCTCTGCAATAGGTACTCC-3 |
256 bp |
OIE [14] |
|
R5-CGCTGTTGTACCTGGAAAGG-3 |
|||
|
VT2 |
F5-TCCATGACAACGGACAGCAG-3 |
185 bp |
|
|
R5-GCTTCTGCTGTGACAGTGAC-3 |
|||
|
eaeA |
F5-GCTTAGTGCTGGTTTAGGATTG-3 |
618 bp |
|
|
R5-CCAGTGAACTACCGTCAAAG-3 |
5μl of genomic DNA, 12.5μl of dream taq green master mix (Thermoscientific #K1081), 1μl of each primer (50 pmole) and 5.5μl of deionized water were added to 0.5ml microfuge tubes. The amplification reactions were performed under following conditions: 94°C for 4 min, then 29 cycles each at 94°C for 90 sec, 62°C for 90 sec and 72°C for 2 min.; lastly 72°C for 10 min [13].
Virulence gene detection
Recovered pathogenic isolates were used to detect major virulence genes including VT1, VT2 and eaeA genes. Specific primers shown in Table 1.
Polymerase chain reaction
5μl of genomic DNA, 12.5μl of dream taq green master mix (Thermoscientific #K1081), 1μl of each primer (50 pmole) and 5.5μl of deionized water were added to 0.5ml microfuge tubes. The amplification reactions were performed under following conditions: 94°C for 2 min, then 25 cycles each at 94°C for 60 sec, 62°C for 90 sec and 72°C for 2 min.; lastly 72°C for 5 min [14].
RESULTS
Prevalence of diarrhea in examined calves
Clinical examination of examined calves showed that, a total 43 out of 161 calves (24 out of 60 from group I calves, 11 out of 55 group II calves and 8 out of 64 group III calves) suffer from diarrhea which ranged from pasty to watery feces, varying degree of dehydration, off food and weakness representing prevalence rates 40%, 20% and 17% respectively. Regarding the prevalence of diarrhea in the farms, it was found that 7 out of 32, 5 out of 17, 9 out of 40 and 22 out of 70 calves suffering from diarrhea from farm 1, 2, 3 and 4 respectively representing prevalence rates 22%, 29% , 21% and 31% respectively as shown in Table 2 and Figure 1.
|
Ages group
|
Total Ex |
Farm (1) |
Farm (2) |
Farm (3) |
Farm (4) |
Total D |
Age Prev |
||||
|
Ex |
D |
Ex |
D |
Ex |
D |
Ex |
D |
||||
|
Group I |
60 |
20 |
4 |
8 |
4 |
15 |
5 |
17 |
11 |
24 |
40 |
|
Group II |
55 |
8 |
2 |
4 |
1 |
16 |
3 |
27 |
5 |
11 |
20 |
|
Group III |
46 |
4 |
1 |
5 |
0 |
11 |
1 |
26 |
6 |
8 |
17 |
|
Total |
161 |
32 |
7 |
17 |
5 |
42 |
9 |
70 |
22 |
43 |
27 |
|
Farms Prev |
22% |
29% |
21% |
31% |
|||||||
Table 2: Prevalence of diarrhea in examined calves related to age and farms.
Ex: Examined; D: Diseased; Prev: Prevalence
Isolation and identification of E-coli
Colonial morphology
Only 35 out of 43 isolates recovered from diarrheic calves while 10 out of 18 isolates recovered from human workers showed pink-colored smooth colonies on macConkey agar and produced distinct, clear greenish metallic sheen over EMB. All isolates were Gram negative, motile, non-sporulated and medium sized bacilli.
Biochemical identification
By using API 20E identification system, the suspected E. coli isolates were 23 out of 35 calves isolates while 9 out of 10 human isolates representing recovery rates 66% and 90% respectively. The biochemical reactions were classified into five groups as shown in Table 3. The first group includes 9 out of 23 calve isolates and 5 out of 10 human isolates and gave positive reaction with ONPG, ADH, LDC, ODC, TDA, IND, GLU, MAN, SOR, RHA, SAC, MEL and ARA tests and negative reaction with CIT, H2S, URE, VIP, GEL, INO and AMY tests. The second group includes 5 out of 23 calve isolates and 4 out of 10 human isolates and gave positive reaction with ONPG, LDC, ODC, TDA, IND, GLU, MAN, SOR, RHA, SAC, MEL and ARA tests and negative reaction with ADH, CIT, H2S, URE, VIP, GEL, INO and AMY tests. The third one includes 4 out of 23 calve isolates and gave positive reaction with ONPG, ADH, LDC, ODC, TDA, IND, GLU, MAN, SOR, RHA, MEL and ARA tests and negative reaction with CIT, H2S, URE, VIP, GEL, INO, SAC and AMY tests. The fourth one includes 3 out of 23 calve isolates gave positive reaction with ONPG, ADH, LDC, TDA, IND, GLU, MAN, SOR, RHA, SAC, MEL and ARA tests and negative reaction with ODC, CIT, H2S, URE, VIP, GEL, INO and AMY tests. The last 5th group includes 2 out of 23 calve isolates and gave positive reaction with ONPG, LDC, TDA, IND, GLU, MAN, SOR, RHA, SAC, MEL and ARA tests and negative reaction with ADH, ODC, CIT, H2S, URE, VIP, GEL, INO and AMY tests.
|
Type of samples |
No of Samples |
API 20E RESULTS |
No. of Recovered isolates |
Recovery rate |
|||||||||||||||||||||
|
Calve isolates |
35 |
ONPG |
ADH |
LDC |
ODC |
CIT |
H2S |
URE |
TDA |
IND |
VP |
GEL |
GLU |
MAN |
INO |
SOR |
RHA |
SAC |
MEL |
AMY |
ARA |
OX |
|||
|
+ |
+ |
+ |
+ |
- |
- |
- |
+ |
+ |
- |
- |
+ |
+ |
- |
+ |
+ |
+ |
+ |
- |
+ |
- |
9 |
23 |
66% |
||
|
+ |
- |
+ |
+ |
- |
- |
- |
+ |
+ |
- |
- |
+ |
+ |
- |
+ |
+ |
+ |
+ |
- |
+ |
- |
5 |
||||
|
+ |
+ |
+ |
+ |
- |
- |
- |
+ |
+ |
- |
- |
+ |
+ |
- |
+ |
+ |
- |
+ |
- |
+ |
- |
4 |
||||
|
+ |
+ |
+ |
- |
- |
- |
- |
+ |
+ |
- |
- |
+ |
+ |
- |
+ |
+ |
+ |
+ |
- |
+ |
- |
3 |
||||
|
+ |
- |
+ |
- |
- |
- |
- |
+ |
+ |
- |
- |
+ |
+ |
- |
+ |
+ |
+ |
+ |
- |
+ |
- |
2 |
||||
|
Human isolates |
10 |
+ |
+ |
+ |
+ |
- |
- |
- |
+ |
+ |
- |
- |
+ |
+ |
- |
+ |
+ |
+ |
+ |
- |
+ |
- |
5 |
9 |
90% |
|
+ |
- |
+ |
+ |
- |
- |
- |
+ |
+ |
- |
- |
+ |
+ |
- |
+ |
+ |
+ |
+ |
- |
+ |
- |
4 |
||||
|
Total |
45 |
5 biochemical reactions |
32 |
||||||||||||||||||||||
Table 3: Identification of E coli isolates using API 20E identification system.
Genotypic identification
All 23 calves isolates and 9 human isolates were identified as E. coli using 16s rRNA gene primer giving a PCR product at the prospected size of 585 bp [13] as shown in Figure 2.
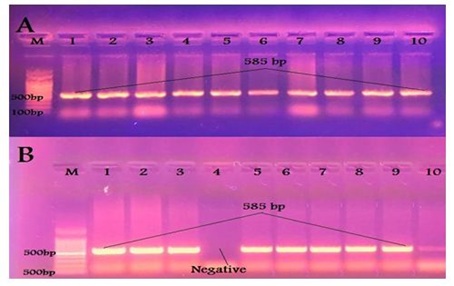 Figure 2: Results of PCR using specific primer of 16S rRNA gene of E. coli (A) Samples taken from diarrheic calves. (B) Samples taken from diarrheic workers.
coli isolation rates according to age of calves
Regarding to age, the highest isolation rate of E. coli were recorded in group I by 77% where 20 out of 24 samples were finally identified as E. coli followed by 18% in group II where 2 samples out 11 were identified as E. coli. Regarding group III, it recorded 13% representing the lowest isolation rate where only 1 sample out of 8 was identified as E. coli. Meanwhile in human samples E. coli was recovered from 50% of the collected samples where 9 out of 18 samples were identified as E. coli as shown in Table 4.
|
Age group |
Diseased |
Identified E. coli |
% |
|
Group I |
24 |
20 |
77 |
|
Group II |
11 |
2 |
18 |
|
Group III |
8 |
1 |
13 |
|
Total |
43 |
23 |
53 |
|
Humans |
18 |
9 |
50 |
Table 4: Percent of isolation of E. coli according to age of calves.
Isolated coli virulence genes profiling
The virulence genes profile of E. coli isolates was studied and it was found that VT1, VT2 and eaeA gens were successfully amplified in 1, 7 and 7 out of 23 calf isolates giving rise the prospected PCR products of 256, 185 and 618 bp respectively as mentioned in OIE [14]. Also only VT1 and VT2 in 5 and 4 out of 9 human isolates respectively while eaeA gave no positive reaction with the human isolates, as shown in Table 5 and Figures 3-5. Regarding the correlation between virulence genes in the isolated E. coli, it was found that, there is only one animal isolate carry both VT1 and eaeA virulence genes while there are 4 animal isolates carry both VT2 and eaeA virulence genes. Meanwhile in human isolates there is no isolates carry more than one virulence gene.
|
Species
|
Total isolates
|
Virulence gene |
Pathotypes |
|||
|
Vt1 |
Vt2 |
eaeA |
STEC |
EPEC |
||
|
Calves
|
23 |
1 |
7 |
7 |
8 35% |
7 30% |
|
Humans
|
9 |
5 |
4 |
0 |
9 100% |
0 |
|
Total |
32 |
6 |
11 |
7 |
17 53% |
7 22% |
|
Percent |
||||||
Table 5: Studying the virulence gene profile of E. coli isolated from diarrheic calves and human.
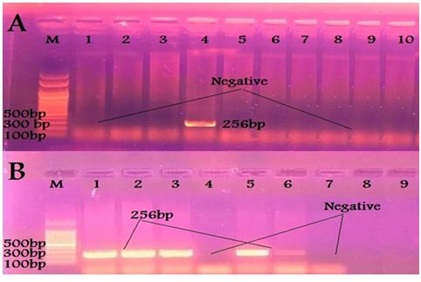 Figure 3: Results of PCR using specific primer of VT1 gene of E. coli (A) Samples taken from diarrheic calves. (B) Samples taken from diarrheic workers.
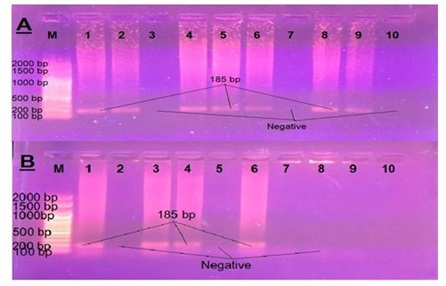 Figure 4: Results of PCR using specific primer of VT2 gene of E. coli (A) Samples taken from diarrheic calves. (B) Samples taken from diarrheic workers.
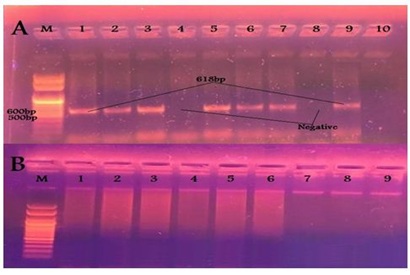 Figure 5: Results of PCR using specific primer of eaeA gene of E. coli (A) Samples taken from diarrheic calves. (B) Samples taken from diarrheic workers.
Isolated coli pathotyping
Depending on the virulence gene profiling of E. coli isolates as shown in Table 5, it is clear that, there was 8 out 23 animal isolates were STEC representing 35% of total animal isolates and 7 out of 23 animal isolates were EPEC representing 30% of total animal isolates. Meanwhile, 100% of the human isolates were STEC.
DISCUSSION
A total number of 43 fresh fecal samples were collected directly under aseptic condition from the rectum of diseased calves (out of 161clinicaly examined calves) as well as 18 stool swab samples from human workers then transferred to the microbiological laboratory for bacteriological and molecular examination. The colonial and morphological isolation revealed that, only 35 out of 43 isolates recovered from diarrheic calves while 10 out of 18 isolates recovered from human workers showed pink-colored smooth colonies on macConkey agar and produced distinct, clear greenish metallic sheen over EMB and all isolates were Gram negative, motile, non- sporulated, medium sized bacilli. On the other hand the biochemical identification using API 20E identification system revealed that 23 isolates out of 35 suspected calves’ isolates and 9 out of 10 suspected human isolates representing recovery rates 66% and 90% respectively proved to be E. coli as shown in Table 3. All 23 calves and 9 human isolates were genotypically identified as E. coli by amplification of universal 16s rRNA gene giving the prospected PCR product of 585 bp as confirmed by Tonu et al., [13] as shown in Figure 2. Higher percent of E. coli were isolated by Elseedy et al., [19] who concluded that out of 127 collected fecal samples from diarrheic calves, 119 (93.7%) bacterial isolates were recovered, including 23 (18.1%) Salmonella serovars and 96 (75.6%) were E. coli strains. On contrary, a lower E. coli isolation percent (10%) was isolated by Olaogun et al., [17] from three farms in Oyo and Ogun States, Nigeria and 45% by Paul et al., [20] in some selected areas of Bangladesh. Also among 84 diarrheic calves samples, 30 (35.71%) E. coli were isolated by Masud et al., [21]. The difference in the prevalence of E. coli were explained by Cho and Yoon [15] who concluded its relation to geographical location of the farms, farm management practices and herd size.
Regarding to age, the highest isolation rate of E. coli were recorded in group I that aged from 1 day to 1 month by 77% where 20 out of 24 samples were finally identified as E. coli followed by 18% in group II that aged more than 1 month up to 3 month where 2 samples out 11 were identified as E. coli. Regarding group III that aged more than 3 month up to 6 month, it recorded 13% representing the lowest isolation rate where only 1 sample out of 8 was identified as E. coli. Meanwhile in human samples E. coli was recovered from 50% of the collected samples where 9 out of 18 samples were identified as E. coli as shown in Table 4. Anwarullah et al., [12] reported that the highest isolation rate of E. coli was recorded in old age group than young one representing 1.33%, 4%, 9.33% in similar groups respectively.
E. coli can be classified into six pathogroups based on virulence scheme: Enterotoxigenic E. coli (ETEC), Shiga Toxin-producing E. coli, Enteropathogenic E. coli, Enteroinvasive E. coli, Enteroaggregative E. coli and enterohaemorrhagic E. coli [22]. Although there are a wide range of different virulence factors that may play a role in the pathogenesis of E. coli, the present study investigated the presence of only 3 virulence genes encoding putative virulence factors and the obtained 23 isolates of E. coli were screened for the presence of certain Virulence factors, shiga toxin production (VT1 and VT2 genes), attaching and effacing character (eae A gene) and it was found that VT1, VT2 and eaeA gens were successfully amplified in 1, 7 and 7 out of 23 calve isolates giving rise the prospected PCR products of 256, 185 and 618 bp respectively as described in OIE [14]. Also only VT1 and VT2 in 5 and 4 out of 9 human isolates respectively while eaeA gave no positive reaction with the human isolates as shown in Table 5. Regarding the correlation between virulence genes in the isolated E. coli, it was found that, there is only one calf isolate carry both VT1 and eaeA virulence genes while there are 4 calves isolates carry both VT2 and eaeA virulence genes. Meanwhile in human isolates there is no isolates carry more than one virulence gene.
Depending on the virulence gene profiling of E. coli isolates, it is clear that, there was 8 out 23 animal isolates were STEC representing 35% of total animal isolates and 7 out of 23 animal isolates were EPEC representing 30% of total animal isolates. Meanwhile, 100% of the human isolates were STEC. The overall prevalence of STEC in all samples and farms was 53%. Different prevalence of STEC among calves was studied and was 20% by Shaw et al., [23] 37.5% by Fukushima and Seki [24] 12.14% by Tahamtan et al., [25] 17.7% by Irshad et al., [26] and 22.7% by Kohansal and Asad [27].
Dastmalchi and Ayremlou [28] reported that, prevalence was 19.6% among diarrheic calves, 23.1% carried VT1 gene, 26.92% possessed VT2 gene while 13 isolates (50%) gave positive amplicon for both VT1 and VT2 genes. Shahrani et al., [29] and Akter et al., [30] concluded that VT1 is the most prevalent than VT2. Prevalence of 51% among calves was obtained by Wang et al., [31] which was closely contact to our finding. Higher prevalence 83% among diarrheic calves was obtained by Pervez et al., [32]. The highest STEC prevalence was detected in age under one month as shown in Tables 4 and 5. Similar results was observed by Cobbold and Esmarchelier [33], they concluded that calves as young as 48 to 72h old excrete STEC. Humans can become infected with STEC by ingesting contaminated food or water or by transmission from infected animals or humans [34]. Prevalence of STEC infection in human was 15% by Salmanzadeh-Ahrabi et al., [35], 2.3% by Rajendran et al., [36], 1.7% by van Duynhoven et al., [37], 7% was reported in patients with diarrhoea in Morogoro, Tanzania in 2006 by Raji et al., [38] and 56% by Matussek et al., [39]. The overall prevalence of virulence-associated gene VT1 only, VT2 only, VT1and VT2 and eaeA were 10.7%, 20.8%, 68.5%, 3.9%, respectively as reported by Wang et al., [31]. Pervez et al., [32] reported that 10% of the isolates of calves were positive for VT1 gene while eaeA not detected. The VT1 gene was detected more frequently in calves than in adult animals [40].
Some factors that contribute to the presence and spread of STEC in a herd are the management practices, stress, diet, population density, geographic region and season [41]. Contact with feces of cattle, direct contact with the animals or their environment and consumption of contaminated beef, milk, dairy products, water, unpasteurized apple juices and vegetables are possible routes for STEC human exposure and disease [42]. So, measures to prevent direct contact with animal fecal material in the environment include the wearing of protective clothing, increased hand washing and targeted education of the population at risk regarding possible sources of STEC infection.
So, from the previously mentioned results, we discerned that there is a correlation between E. coli pathotypes isolated from animals and contact humans but, further study is needed and will be done to study the sequence analysis of amplified genes to discuss deeply the direct relation between human and animal pathotypes. Other studies may be recommended to cover other different virulence genes of different E. coli pathotypes like Enterotoxigenic (ETEC), Enteroaggregative (EAEC) and enteroinvasive E. coli.
Also, our finding can concluded to the risk of increasing the prevalence of pathogenic E. coli increase with the decrease in ages of susceptible calves, control and management of the diarrhea in calves should referenced to the actual situation of the exact farm regarding antibiotic therapy, autovaccination of calves and housing parameters. Cross infection of pathogenic E. coli between infected animals and contact workers is highly possible. Biosafety and biosecurity measures should be implemented to minimize the risk of calves' infection and cross infection between human and animals.
REFERENCES
- Walker CL, Aryee MJ, Boschi-Pinto C, Black RE (2012) Estimating diarrhea mortality among young children in low and middle income countries. PLoS One 7: 29151.
- Nguyen TD, Vo TT, Vu-Khac H (2011) Virulence factors in Escherichia coli isolated from calves with diarrhea in Vietnam. J Vet Sci 12: 159-164.
- Croxen MA, Finlay BB (2010) Molecular mechanisms of Escherichia coli Nat Rev Microbiol 8: 26-38.
- Abe CM, Trabulsi LR, Blanco J, Blanco M, Dahbi G, et al. (2009) Virulence features of atypical enteropathogenic Escherichia coli identified by the eae(+) EAF-negative stx(-) genetic profile. Diagn Microbiol Infect Dis 64: 357-365.
- Mainil JG, Daube G (2005) Verotoxigenic Escherichia coli from animals, humans and foods: Who's who? J Appl Microbiol 98: 1332-1344.
- Bashahun GM, Amina A (2017) Colibacillosis in calves: A review of literature. Journal of animal science and veterinary medicine 2: 62-71.
- Lee MS, Koo S, Jeong DG, Tesh VL (2016) Shiga Toxins as Multi-Functional Proteins: Induction of Host Cellular Stress Responses, Role in Pathogenesis and Therapeutic Applications. Toxins (Basel) 8: 77.
- Begum YA, Rydberg HA, Thorell K, Kwak YK, Sun L, et al. (2018) In Situ Analyses Directly in Diarrheal Stool Reveal Large Variations in Bacterial Load and Active Toxin Expression of Enterotoxigenic Escherichiacoli and Vibrio cholerae. mSphere 3: 00517-00617.
- Tarr GAM, Lin CY, Diane L, Linda C, Tar PI, et al. (2019) Performance of commercial tests for molecular detection of Shiga Toxin-producing Escherichia Coli (STEC): A systematic review and meta-analysis protocol. BMJ open 9: 025950.
- Rice T, Quinn N, Sleator RD, Lucey B (2016) Changing Diagnostic Methods and Increased Detection of Verotoxigenic Escherichia coli, Ireland. Emerg Infect Dis 22: 1656-1657.
- Weston SA, Tucker AD, Thatcher DR, Derbyshire DJ, Pauptit RA (1994) X-ray structure of recombinant ricin A-chain at 1.8 A resolution. J Mol Biol 244: 410-422.
- Anwarullah M, Khan JA, Khan MS, Ashraf K, Avais M (2014) Prevalence of salmonella and Escherichia coli associated with diarrhea in buffalo and cow calves. Buffalo Bulletin 33: 332-336.
- Tonu NS, Sufian MA, Sarker S, Kamal MM, Rahman MH, et al. (2011) Pathological study on colibacillosis in chickens and detection of coli by PCR. Bangladesh Journal of Veterinary Medicine 9: 17-25.
- OIE (2017) Mannual of diagnostic tests and vaccines for Terrestrial Animals. World Organisation for Animal Health, Paris, France.
- Cho Y, Yoon KJ (2014) An overview of calf diarrhea - infectious etiology, diagnosis, and intervention. J Vet Sci 15: 1-17.
- García A, Ruiz-Santa-Quiteria JA, Orden JA, Cid D, Sanz R, et al. (2000) Rotavirus and concurrent infections with other enteropathogens in neonatal diarrheic dairy calves in Spain. Comp Immunol Microbiol Infect Dis 23: 175-183.
- Olaogun SC, Jeremiah OT, Jubril AJ, Adewuyi OO (2016) Calf Diarrhea: Epidemiological Prevalence and Bacterial Load in Oyo and Ogun States, Nigeria. Alexandria Journal of Veterinary Sciences 51: 90-96.
- Achá SJ, Kühn I, Jonsson P, Mbazima G, Katouli M, et al. (2004) Studies on calf diarrhoea in Mozambique: Prevalence of bacterial pathogens. Acta Vet Scand 45: 27-36.
- El-Seedy FR, Abed AH, Yanni HA, Abd El-Rahman SAA (2016) Prevalence of Salmonella and coli in neonatal diarrheic calves. Beni-Suef University Journal of Basic and Applied Sciences 5: 45-51.
- Paul SK, Khan MSR, Rashid MA, Hassan J, Mahmud SMS (2010) Isolation and characterization of Escherichia coli from buffalo calves in some selected areas of Bangladesh. Bangl J Vet Med 8: 23-26.
- Masud MA, Fakhruzzaman M, Rahman MM, Shah MM, Nazir K (2012) Isolation of Escherichia coli from apparently healthy and diarrheic calves in Dinajpur area in Bangladesh and their antibiogram. J Bangladesh Soc Agric Sci Technol 9: 45-48.
- Kaper JB, Nataro JP, Mobley HL (2004) Pathogenic Escherichia coli. Nat Rev Microbiol 2: 123-140.
- Shaw DJ, Jenkins C, Pearce MC, Cheasty T, Gunn GJ, et al. (2004) Shedding patterns of verocytotoxin-producing Escherichia coli strains in a cohort of calves and their dams on a Scottish beef farm. Appl Environ Microbiol 70: 7456-7465.
- Fukushima H, Seki R (2004) High numbers of Shiga toxin-producing Escherichia coli found in bovine faeces collected at slaughter in Japan. FEMS Microbiol Lett 238: 189-197.
- Tahamtan Y, Hayati M, Namavari MM (2010) Prevalence and distribution of the stx1, stx2 genes in Shiga toxin producing coli (STEC) isolates from cattle. Iran J Microbiol 2: 8-13.
- Irshad H, Cookson AL, Hotter G, Besser TE, On SL, et al. (2012) Epidemiology of Shiga toxin-producing Escherichia coli O157 in very young calves in the North Island of New Zealand. N Z Vet J 60: 21-26.
- Kohansal M, Ghanbari Asad A (2018) Molecular analysis of Shiga toxin-producing Escherichia coli O157:H7 and non-O157 strains isolated from calves. Onderstepoort J Vet Res 17: 1-7.
- Dastmalchi SH, Ayremlou N (2012) Characterization of Shiga toxin-producing Escherichia coli (STEC) in feces of healthy and diarrheic calves in Urmia region, Iran J Microbiol 4: 63-69.
- Shahrani M, Dehkordi FS, Momtaz H (2014) Characterization of Escherichia coli virulence genes, pathotypes and antibiotic resistance properties in diarrheic calves in Iran. Biol Res 47: 28.
- Akter MM, Majumder S, Nazir KHMNH, Rahman M (2016) Prevalence and molecular detection of shiga toxin producing Escherichia coli from diarrheic cattle. J Bangladesh Agril Univ 14: 63-68.
- Wang LYR, Jokinen CC, Laing CR, Johnson RP, Ziebell K, et al. (2018) Multi-Year Persistence of Verotoxigenic Escherichia coli (VTEC) in a Closed Canadian Beef Herd: A Cohort Study. Front Microbiol 9: 2040.
- Pervez A, Anjum FR, Bukhari AA, Anam S, Rahman SU, et al. (2018) Isolation and Virulence Genes Characterization of Diarrheagenic Escherichia coli from Calves. Pak Vet J 38: 133-136.
- Cobbold R, Desmarchelier P (2000) A longitudinal study of Shiga-Toxigenic Escherichia Coli (STEC) prevalence in three Australian diary herds. Vet Microbiol 71: 125-137.
- Willshaw GA, Cheasty T, Smith HR, O'Brien SJ, Adak GK (2001) Verocytotoxin-producing Escherichia coli (VTEC) O157 and other VTEC from human infections in England and Wales: 1995-1998. J Med Microbiol 50: 135-142.
- Salmanzadeh-Ahrabi S, Habibi E, Jaafari F, Zali MR (2005) Molecular epidemiology of Escherichia coli diarrhoea in children in Tehran. Ann Trop Paediatr 25: 35-39.
- Rajendran P, Rajan DP, Kang G, Thorpe CM (2009) Shiga toxin-producing Escherichia coli infection in South India. J Med Microbiol 58: 1525-1526.
- van Duynhoven YT, Friesema IH, Schuurman T, Roovers A, van Zwet AA, et al. (2008) Prevalence, characterisation and clinical profiles of Shiga toxin-producing Escherichia coli in The Netherlands. Clin Microbiol Infect 14: 437-445.
- Rajii MA, Minga UM, Machang'u RS (2008) Prevalence and characterization of verotocytoxin producing Escherichia coli O157 from diarrhoea patients in Morogoro, Tanzania. Tanzan J Health Res 10: 151-158.
- Matussek A, Einemo IM, Jogenfors A, Löfdahl S, Löfgren S (2015) Shiga Toxin-Producing Escherichia coli in Diarrheal Stool of Swedish Children: Evaluation of Polymerase Chain Reaction Screening and Duration of Shiga Toxin Shedding. J J Pediatric Infect Dis Soc 5: 147-151.
- Ferreira MRA, Stella AE, Freitas-Filho E, Silva TDS, Nascimento KA, et al. (2018) Distribution of the stx1 and stx2 genes in Escherichia coli isolated from milk cattle according to season, age, and production scale in southwestern region of Goiás, Brazil. Arquivo Brasileiro de Medicina Veterinária e Zootecnia, 70: 1807-1813.
- Ferreira MR, Freitas Filho EG, Pinto JF, Dias M, Moreira CN (2014) Isolation, prevalence, and risk factors for infection by Shiga Toxin-producing Escherichia Coli (STEC) in dairy cattle. Trop Anim Health Prod 46: 635-639.
- Cáceres ME, Etcheverría AI, Fernández D, Rodríguez EM, Padola NL (2017) Variation in the Distribution of Putative Virulence and Colonization Factors in Shiga Toxin-Producing Escherichia coli Isolated from Different Categories of Cattle. Front Cell Infect Microbiol 7: 147.
Citation: Gamal FE, Diab MS, Gadallah FM, Awad N, Soliman EM, et al. (2019) Correlation between Virulence Genes Profile of Currently Circulating E. coli Pathotypes Isolated from Diarrheic Calves and Humans. J Vaccines Res Vaccin 5: 009.
Copyright: © 2019 Fatma Elzhraa Gamal, et al. This is an open-access article distributed under the terms of the Creative Commons Attribution License, which permits unrestricted use, distribution, and reproduction in any medium, provided the original author and source are credited.