Detection of Reactive Oxygen Species as a Possible Maker of Quality of Bovine Meat
*Corresponding Author(s):
ThaísRezende Leite&Laboratory Of Food Microbiology, School Of Agronomy And Veterinary Medicine, University Of Brasília, Federal District, Brazil
Tel:+55 34999798484,
Email:thaisrleite71@gmail.com
Abstract
The aim was to detect Reactive Oxygen Species (ROS) and evaluate the quality of carcasses and beef from cold storage slaughterhouses located at the Federal District area, and the possible use of the ROS as a quality marker. Data and samples obtained from a total of 33 animals and their respective carcasses. Fragments of the extensor carpi radial is muscle were extracted to analyze the presence ROS, and samples of the Longissimus dorsi, 24h post-mortem for pH, colorimetric test, cooking loss and drip loss assessment and the sheer force. The presence of hematomas was detected in 28 carcasses, where the tail and croup (17/33) and flank (17/33) regions were the most affected. The electron paramagnetic resonance indicated an average of 52.59 ROS/g in the analyzed pieces. The meat quality tests indicated: 5.8 for the 24h post-mortem pH, L*29.34, a* 2.52 and b* 1.31 in calorimetry, 2.30 kg/f for the shearing force, 11.75% of cooking losses and 1.88% of drip losses. The statistical analyses demonstrated a tendency to positive correlation between the presence of hematomas with and the amount of ROS, and between the presence of hematomas and pH value.
Keywords
Cattle; Meat quality; Reactive oxygen species; Slaughterhouse
INTRODUCTION
Brazil’s livestock farming stands out as an important sector of the national economy, and in the year 2016, Brazil kept its spotlight in the international market as the world’s greatest beef meat exporter [1].
To maintain the competitiveness, it has invested in the productivity and quality of the final product offered to the consumer [2]. In beef, tenderness, flavor, juiciness and color are desired as determining characteristics for the purchase decision, which are susceptible to changes due to intrinsic factors such as the gender, age and breed, and extrinsic factors such as nutrition and stress during handling [3].
Studies on meat quality often correlate evaluating characteristics of meat produced by crossbreeding and the comparison of age and diet [4-6] and the main analyzed characteristics are the pH, colorimetry and shearing force as Klont [7]; Wheeler [8]; AMSA [9], as well as water retention capacity when measured by evaluating cooking and drip losses [4]. There are still no studies that perform the detection of reactive species of oxygen as a parameter of quality beef.
Still related to the meat quality is the pre-slaughter handling performed by the farms and industries of meat, which can generate stress, contusions and hematomas in the animal, interfering with meat quality at the end of the process and causing economic losses to the producer and the industry according Romero [10]; Alves [11].
Electron Paramagnetic Resonance spectroscopy (EPR) is a technique that has been applied to some foods, making it possible to detect free radicals at an intracellular and extracellular level thus allowing the correlation of the presence of free radicals with the quality of the final product [12]. Chen [13], used the EPR technique to evaluate the oxidative stress mechanism in broiler chickens. The authors confirmed that oxidative stress induced by H2O2 had a negative effect on relative muscle weight, the significantly higher ROS formation in the muscle show lower quality meat, with lower pH 24h value, higher shearing force and greater drip losses [13]. Another study applied EPR to measure the meat quality of pigs shortly after slaughter. The authors observed that oxidation occurred differently in the different muscle tissues and that this process can reduce meat quality, changing the flavor, coloration, drip and cooking losses.
To this moment, no scientific findings were found to correlate the detection of reactive oxygen species with the beef meat quality in combination with the pre-slaughter handling of the livestock. In the region of the Federal District and Surroundings there is no information on the characteristics of beef meat quality meant for sale in terms of the pH, tenderness, cooking and drip losses, as well as the characterization of the pre-slaughter handling and their consequences in the conversion of muscle into meat in the daily routine of the regional cold storage industry.
Considering the importance of the behavior of the organoleptic characteristics of beef meat, as well as the pre-slaughter handling, this project aimed to evaluate the 24h post-mortem pH and coloration, the drip and cooking liquid losses and the shearing force in beef meat from cold storage slaughterhouses located in the Federal District and Surroundings, and to detect reactive oxygen species in muscle tissues by electron paramagnetic resonance, as well as evaluate a possible correlation with the quality beef parameters.
MATERIALS AND METHODS
The collection of data and samples was performed in cold storage beef slaughterhouses located in the Federal District and Surroundings. All slaughterhouses were certified by an official inspection service such as SIF or SISBL and the animals were subject to the norms of Humane Slaughter outlined in the Normative Instruction no. 3, of January 17th, 2000, according to the Ministry of Agriculture, Livestock and Supply [14]. Four collections were performed between April and September, 2017 and 33 beef carcasses were obtained in total.
During the pre-slaughter handling in the cold storage slaughterhouses, information was obtained on the travel time (h) and distance (km) from the location of the rural property from which the animals originated, as well as the identification of the animals by batch, breed, age and gender with Animal Transit Guide. After the desensitization, bleeding and skinning procedures, pieces of approximately 3.0cm of the extensor carpi radial is muscle were collected and frozen in liquid nitrogen for the subsequent quantification of reactive oxygen species. Next, the number and location of hematomas in the carcasses were evaluated, dividing them into regions proposed by the methodology by Cardoso [15].
After the cooling of the 33 carcasses for 24h in the slaughterhouse refrigeration chamber, a piece of the Longissimus dorsi muscle of approximately 500g was removed, 2.5cm thick, between the 10th and 12th rib for the meat quality analyses.
For the quantification of reactive oxygen species in the muscle tissue, the protocol recommended by Mrakic-Sposta [16], was followed. The pieces of the extensor carpi radial is muscle (we give preference to a musculature that could be removed as soon as possible to detect the ROS) immersed in liquid nitrogen were transported to the Laboratory of Biochemistry and Protein Chemistry at the University of Brasília to prepare the samples for the paramagnetic resonance spectroscopy analyses at the Laboratory of Electron Paramagnetic Resonance at the Institute of Physics.
The pH was measured with a portable digital pH meter (Testo® 205) equipped with an insertion electrode. The samples of 24h post-mortem beef meat were exposed to atmospheric air for 30 minutes, followed by three readings at different points and the calculation of their arithmetic mean. A portable Chroma Meter Cr-400 (Minolta Camera Co., Ltda., Osaka, Japan) colorimeter was used. To determine the color, the CIELAB color space was adopted, which applied the lightness (L*) coordinates varying from 0 (black) to 100 (white), shades of red (a*+) to green (a*-), and shades of yellow (b*+) to blue (b*-).
To evaluate the weight loss during the cooking, the procedure recommended by AMSA [9], with adaptations, and used the calculation: Cooking loss = [(weight of raw steak – cooked weight) ÷ weight of raw steak] × 100. After this procedure, the samples were individually packaged in low-density polyethylene bags, properly identified and stored under refrigeration at 4ºC for 24h for the subsequent performance of the shearing force test.
The protocol recommended by Wheeler [8], was applied. Three cylindrical pieces were collected from each meat sample, cut parallel to the direction of the muscle fiber using a perforator. These three sub samples underwent the shearing test using equipment of model WARNER-BRATZLER MEAT SHEAR® (G-R Manufacturing Co. Manhattan), 235 6X. The results were given in Kg/f and the mean between the three sub samples was calculated to represent the force used to cut each sample.
The drip loss was measured according to the procedure recommended by Honikel [17], with adaptations by Kim [18].
A piece of approximately 50g was removed 24h post mortem from each beef meat sample from the refrigerated slaughterhouses.
The samples were individually placed in polyethylene nets. They were then suspended by a hook, wrapped by a polyethylene bag with no contact with the sample and stored under refrigeration at 4ºC for 48 h. After that, we calculated the loses: Drip loss = [weight after the dripping ÷ weight before] × 100.
The samples of the pieces of the extensor carpi radial is muscle collected shortly after the bleeding were frozen in liquid nitrogen and taken to the Laboratory of Biochemistry and Protein Chemistry of the University of Brasília, where they were subjected to freezing at -80ºC until the preparation of the samples.
They were removed from the freezer and then cut with a scalpel, reduced to four parts of approximately 2x2x2 mm. Next, the tissues were washed thrice with a KHB solution (Krebs Hepes, Noxygen, Germany). After washing, 700µL of CMH (1-hydroxy-3-methylcarbonyl-2,2,5,5-tetramethylpyrrolidine) was added at a concentration of 200µM (Noxygen®, Germany) and 50UI/mL of sodium heparin (Hepamax-S®, Blausiegel Ind. Com. Ltda., São Paulo, Brazil) was added. Samples were incubated under agitation at 37ºC for 60 minutes. Incubation was followed by the removal of 450µL of the supernatant, which was transferred to a 1mL syringe for immediate freezing in liquid nitrogen and subsequent storage at -80 ºC until the reading by the electron paramagnetic resonance spectrometer.
The remaining pieces of muscle tissue in the eppendorf tubes were dehydrated in Speed Vac (Savant SC100) apparatus and weighed for the calculation of the reactive oxygen species in the muscle tissue.
The calibration of the electron paramagnetic resonance apparatus and the reactive oxygen species analysis were performed according to the protocol described by Gomes et al. [19]. The measurements were performed at the Laboratory of Electron Paramagnetic Resonance of the Institute of Physics at the University of Brasília.
The X-band Bruker® EMX500 spectrometer apparatus was used (9.45 GHz), 2mW of microwave power, 5 Gauss modulation field, modulation frequency of 100kHz, scan width of 200G, scan time of 10s and 5 scans added in combination for each measurement.
The calibration curve was defined based on Berg et al. [20]. The frozen samples were removed from the syringes and placed individually in the Finger Dewar container (Noxygen® Germany), which was subsequently filled with liquid nitrogen. The Finger Dewar was then coupled to the spectrometer with each sample, still frozen, one at a time, and the detection of the reactive oxygen species was performed individually, which generated a curve corrected for the CP• quantity according to the calibration curve, obtaining the ROS quantification in the sample as the result.
STATISTICAL ANALYSIS
In this article, one program and four tests were used to perform the statistical analysis of the data.
The mean and standard deviation of the samples were performed using the Stata Corp program. 2011. Stata: Release 12. Statistical Software. College Station, TX: Stata Corp LP.
The Shapiro-Wilk test was applied to verify the normal distribution of the analyzed variables (pH and sex). The Kruskal-Wallis test is a non-parametric test, used to verify normality between the days of the collections. The Kolmogorov-Smirnov, also non-parametric, was used to compare the hematoma and pH averages, and the hematoma and reactive oxygen species averages.
RESULTS AND DISCUSSION
The information obtained on the travel distances in (km) and travel time (h) from the property to the cold storage slaughterhouses, of the 33 cattle in this study, as well as the breed, gender and age are presented in table 1.
|
Collections |
Distance (Km) |
Travel time (h) |
Rest time (h) |
Breed |
Gender |
Age in Months |
|
1 |
90 |
1h 20 m |
13h 30m |
Crossbred |
9 Males |
24 - 36 |
|
2 |
130 |
1h 40 m |
13h 30m |
Crossbred |
4 Males |
24 - 36 |
|
3 |
70 |
1h |
16h |
Crossbred |
1 Male 6 Females |
24 - 36 |
|
4 |
140 |
2h |
13h |
Crossbred |
13 Females |
24 - 36 |
|
Total |
|
|
|
|
33 Animals |
|
Table 1: Data on the 33 cattle: travel distance (km) and travel time (h), breed, gender and age (months) obtained at the cold storage slaughterhouses in the 04 collections carried out from April to September, 2017.
The travel distances by road transportation observed in this study were on average 110km and the mean travel time was 1h 50m. The travel time can influence the final quality, therefore, animals travelling long distances (greater than 330km) can present higher final pH (pH>6) compared to the short distance travels, according Batista De Deus et al. [21].
The time from the arrival at the cold storage slaughterhouse to the moment of slaughter ranged from 13 to 16 hours, this rest time corroborates with, which requires rest and fasting of at least 6h at the slaughterhouse, with a possible extension to 24h, when the travel time does not exceed 2 hours for the cattle [22]. However, the latest version does not establish a minimum and maximum period of fasting and water diet [23].
Inevitably, longer travel distances involve longer fasting and water diet periods, which, for prolonged periods (longer than 16 hours) can affect meat quality, causing fatigue and stress to the animal that can lead to an elevated final pH and higher shearing force, and it can also lead to weight loss and dehydration in the cattle according Knowles [24]; Ludtke et al. [25]. The distances found in the present study have short travel times, not requiring long fasting periods and not affecting, in this aspect, the welfare of the animals.
In this study, the presence and location of the hematomas were evaluated in the beef carcasses after skinning and the results are presented in table 2.
|
Region |
Mean of the Values Obtained in the Collections |
Number of Affected |
Percentage with Lesions (%) |
|||
|
|
Collection 1 n=9 |
Collection 2 n=4 |
Collection 3 n=7 |
Collection 4 n=13 |
|
|
|
Tail and croup |
2 |
1 |
5 |
9 |
17 / 33 |
51.5 |
|
Pelvic limb |
5 |
2 |
0 |
0 |
7 / 33 |
21.2 |
|
Flank |
5 |
2 |
3 |
7 |
17 / 33 |
51.5 |
|
Ribs |
1 |
0 |
1 |
1 |
3 / 33 |
9.0 |
|
Thoracic limb |
0 |
0 |
1 |
5 |
6 / 33 |
18.1 |
|
Cervical region |
0 |
0 |
0 |
0 |
0 / 33 |
0.0 |
|
Without hematomas |
3 |
0 |
1 |
2 |
5/33 |
15.1 |
|
Total |
16 |
5 |
11 |
24 |
33/33 |
- |
Table 2: Hematomas detected in the beef carcasses divided according to the affected region in the carcass, number of animals affected and the percentage of animals with lesions in cold storage slaughterhouses from the Federal District and Surroundings.
Among the 33 cattle observed, only 5 animals did not present hematomas. They were observed in the regions of tail and croup, pelvic limb, flank, ribs and thoracic limb. The most affected region was the flank, followed by the croup and tail, as described in table 2. The high percentage of contusions in these areas could be due to improper handling of the animals, the use of sharp objects, poles, electric shock or even trauma caused during the transportation from the rural property to the cold storage slaughterhouse, as described by Huertas et al. [26].
The pelvic limb represented the third most affected area. This high percentage was observed due to the lesions at the metatarsus of a certain batch which presented straight line marks that resembled the shape of a string. Therefore, it is assumed that these hematomas occurred due to the improper restraining at some time during the transportation. The route and the condition of the vehicle should also be considered, because poor road conditions and occupancy could lead to various contusions [24]. The present study did not identify cattle with severe wounds or deep hematomas and none of the animals died in the course of transportation.
In the present study 5 animals did not present any type of hematoma, a value that corresponds to 15% of the animals. This is a positive result when compared to a study by Andrade et al. [27], which evaluated hematomas in cattle transported by river and found 5 animals without lesions among 88 evaluated, representing only 5.8% of the herd.
The combination of the results from the present study identified 11 animals with up to 1 hematoma, 8 animals with 2 and 14 with 3 or more hematoma lesions, results similar to those observed by Bertoloni et al. [28], where 60% of the slaughtered animals presented at least one hematoma in their carcass.
Among the most affected areas by hematomas, the hindquarter region was in second place in the second place, with results like Andrade et al. [27], who formulated the hypothesis of improper handling during the transportation and handling of the animals, which may have included the use of poles or electric stimuli to move them.
In addition to being used as a welfare indicator, hematomas generate economic loss to the producer, given that the meat can be compromised and discarded due to the lesion extension and depth [28]. Handling best practice can avoid great economic losses given that the main noble cuts are located in the most affected regions.
The results for the meat quality tests are presented in table 3.
|
|
Mean Values Obtained from the Collections |
Final the Collections |
Standard Deviation |
|||
|
Quality characteristics of the meat samples |
1 n=9 Males 9 Females 0 |
2 n=4 Males 4 Females 0 |
3 n=7 Males 1 Females 6 |
4 n=13 Males 0 Females 13 |
1 – 4 n=33 Males 14 Females 19 |
1 – 4 n=33 Males 14 Females 19 |
|
pH |
5.94 |
5.84 |
5.83 |
5.83 |
5.86 |
0.285 |
|
Shearing force kg/f |
2.86 |
4.18 |
2.09 |
1.47 |
2.30 |
1.356 |
|
Cooking losses % |
14.76 |
15.73 |
10.58 |
9.07 |
11.75 |
4.563 |
|
Drip losses % |
0.70 |
1.46 |
1.70 |
2.93 |
1.88 |
1.354 |
|
L* |
32.94 |
32.36 |
27.85 |
26.71 |
29.34 |
4.077 |
|
a* |
14.35 |
15.25 |
13.34 |
14.82 |
14.43 |
2.526 |
|
b* |
6.33 |
6.67 |
5.15 |
5.46 |
5.78 |
1.312 |
Table 3: pH, shearing force, cooking losses, drip losses and colorimetric (L*a*b*) analyses of the 33 beef meat samples (Longissimus dorsi) obtained after 24h in cold chamber of cold storage slaughterhouses located in the DF and Surroundings.
Note: L* - lightness; a* - red color intensity; b* - yellow color intensity.
A mean pH of 5.86 was observed in the animals of the present study. This pH value meets the parameter of normal meat (pH<6.0) Adzitey e Nurul [29]. The results also corroborate with Kuss et al. [5], evaluated young cattle (22 months old) entire with the mean 24h post-mortem pH of 5.9. These results are also similar to those observed by Andrade et al. [4], in cattle of the Nelore breed, which found pH from 5.4 to 5.8, and to those in Batista de Deus et al. [21], with the Aberdeen Angus breed, which identified values ranging from 5.6 to 5.78.
Only collection 01 (with a pH value of 5.94) had a pH value approaching the high range (pH≥6.0 according to Adzitey and Nurul [29]. However, it is not possible to state that the observed only the pH in this collection is linked to a long travel time (prolonged chronic stress), given that the mean travel time was 1h 20m, a time shorter than the trips considered long (longer than 3h) [21].
According to the statistical analysis of the relationship of pH with hematoma (presence and absence) in the beef carcasses of the present study, according to the Kolmogorov-Smirnov test, STATA 12®, there was no significant difference (p>0.05) between the means of the two variables. However, the same test highlighted a large difference in the standard deviation. This information indicated a trend where the pH of animals without hematoma lesions presented low variation among the groups (approximately 5.7 to 5.8), while the animals with hematomas presented a wide pH variation range (6.63–5.66), as presented next (Figure 1).
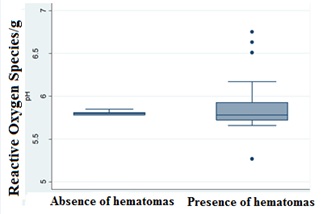 Figure 1: Statistical results presented in Boxplot according to the Kolmogorov-Smirnov Test, STATA 12®, for the evaluation of the relationship between the variables pH versus absence and presence of hematomas.
The tenderness test indicated an overall mean shearing force of 2.30 (kg/f) of all the samples, similar to that observed by Rubiano et al. [30], which mean values of 2.48 for cattle of the Canchim breed and 2.69 for Nelores. Fernandes et al. [31], reported for the same breed a mean value similar to that of the present study, of 3.09 in neutered males. These results accord with Fernandes et al. [31], where values below 5kg/f characterize the meat is tender.
The statistical analysis performed by the Kolmogorov-Smirnov Test, STATA 12®, for the variables of gender (males and females) and shearing force for tenderness, identified a statistically significant difference between the means. The males presented a mean of 3.127 with standard deviation of 1.654, while the females presented a mean of 1.703 with deviation of 0.621, which leads to the conclusion that gender influences the tenderness of beef meat according Alves et al. [32], Hosrt et al. [33].
When evaluated, the results of the present study confirm that the collections that were largely formed by females (collection 3 and collection 4) presented lower shearing force in comparison to the other groups, as previously demonstrated in table 3.
According to the cooking loss test analysis, the present study found values ranging from 4 to 24.07% of total moisture loss, with an overall mean of 11.75%. Differently from the results obtained in this study, greater losses were observed by Barcellos et al. [34], in cattle of the Nelore breed, with moisture losses of 24% and 29% in Angus x Nelore crossbreeds. Andrade et al. [4], found in cattle of the Nelore breed greater losses of 29.1% when compared to the present study. Costa et al. [6], in Red Angus heifers losses between 20.1% and 25.5% and Menezes et al. [35], reported losses of 22.2% in Charolais and 22% in Nelores.
The coloration presented by the 33 cuts of approximately 500 grams obtained after 24h of cooling in cold chamber indicated mean values of 29.34 for L* (lightness), 14.43 for a* (intensity of the red color) and 5.78 for b* (intensity of the yellow color). The animals presented a slightly low L* value. According to Muchenje et al. [36], it is considered normal that when the pH is approximately 5.7, the L* values range between 33.2-41, a* between 11.1–23.6 and b* between 6.1–11.3.
Especially in collections 03 and 04 the L* presented the lowest values (27.85 and 26.71, respectively). When evaluated, the pH of these collections revealed means of 5.83 in both collections. A pH higher than 6.0 could characterize a DFD meat and therefore lower lightness (dark meat) with smaller water retention losses (dry) [25]. When evaluated individually, overall, most of the darkest meat samples (L*<33) presented a pH higher than 5.8. In turn the a* and b* values are in accordance with the previous studies, such as Barcellos et al. [34], for a* of 14.58 and Andrade et al. [4], for b* of 3.78, all performed with cattle of the Nelore breed.
A variety of other factors could influence the coloration, such as the activity level of the animal: Pasture-raised animals exercise more and are slaughtered at a more advanced age, thus presenting higher myoglobin content and having a more intense red color [37].
Drip loss is one of the parameters used to evaluate the Water Retention Capacity (WRC). In the present study, the mean of the collections for the drip losses was 1.88%, unlike those observed by Igarassi et al. [38], who found the value of 4.30% for the drip losses in Red Angus x Nelore animals. Strydom et al. [39], found the value of 2.01% in cattle of the Brahman breed, Hopkins et al. [40], found a mean of 2% in 115 carcasses from cold storage slaughterhouses and Lage et al. [41], found the value of 1.85% in Nelores. The present study indicated low fluid loss, once again, due to the high water retention capacity, a result attributed to the low protein denaturation and high water bond, as described by Adzitey and Nurul [29].
The detection of the reactive oxygen species in the samples of muscle tissue collected post-slaughter was performed using a Bruker® EMX plus EPR X-Band spectrometer. After converting the values of the curve in the proper equation, a numeric value is obtained, which represents the amount of reactive oxygen species detected per gram of tissue. The mean values obtained for the samples of each collection period are found in table 4.
|
|
Mean Values of ROS Obtained for the Four Collections |
Final Mean of the Samples |
|||
|
Performed collections |
1 n=9 |
2 n=4 |
3 n=7 |
4 n=13 |
1 – 4 total n =33 |
|
ROS per gram in the muscle tissue |
39.67 |
35.24 |
99.15 |
36.29 |
52.58 |
Table 4: Mean of the values for the reactive oxygen species obtained by the EPR curve for the muscle tissue samples, per gram.
There are no results of ROS quantification in muscle tissue obtained in post-slaughter of beef meat. Gadjeva et al. [42], used the EPR technique for the detection of free radicals and antioxidant agents in different muscle groups in pork meat in natura, in the range of 2 to 3 hours after slaughter. The researchers detected in the Longissimus muscle a mean value of 7.69±0.91 of ROS per gram, a lower value compared to the means of the other muscles analyzed in the study, the subscapularis (8.66±1.17) and gluteobiceps muscles (8.54±1.05). In the present study, the analyzed muscle piece was the extensor carpi muscle and a higher value was detected in the samples than that found by Gadjeva et al. [42], with the mean value of 52.58 ROS/g for all the collections.
The implications of this high mean are not clear because there still is a lack of studies on the ROS dosage in meats of different domestic species. Hence, some hypotheses can be formulated, which would explain these discrepant results. Firstly, the different species evaluated, since the present study performed the detection of ROS in beef meat samples, while Gadjeva et al. [42], worked with pigs, so it is not possible to compare the results. Other factors that may have influenced the amount of ROS are the selected muscle region and the applied methodology. In this study, the extensor carpi muscle piece was analyzed, collected immediately after slaughter and frozen in liquid nitrogen, while Gadjeva et al. [42], samples were collected from three other muscle regions and removed 3 hours after slaughter on average, which would mean that antioxidant enzymes had been acting for 3h.
Gadjeva et al. [42], present evidence that the Catalase and Superoxide dismutase enzymes decrease the content of free radicals in the muscle cell, decreasing the local oxidative activity in the range of 2 to 3 hours post mortem, since it was observed that when oxidative stress increases, the activity of these enzymes also increases, demonstrating the response of the antioxidant enzymatic system in fresh pork meat. Because in the present study the samples were frozen, these enzymes probably did not have time to act This is one of the most influential surveyed factors for the large number of free radicals detected by the EPR in this study. Therefore, it is necessary to perform further studies and to quantify the reactive oxygen species with different collection and storage conditions and post-slaughter time period [43-58].
Further studies should be performed on this subject, comparing different protocols for the measurement of free radicals with the qualitative analysis of the meat, so it is possible to verify whether the presented amount of ROS is enough to affect the product quality.
The analysis of the variables ROS in the tissue and hematomas (absence or presence) according to the Kolmogorov-Smirnov Test, STATA 12®, indicated no significant difference in the averages evaluated, while there was a difference in the standard deviation results, revealing a trend where animals without hematomas have a smaller and narrower variation rate when compared to animals that presented hematomas (Figure 2).
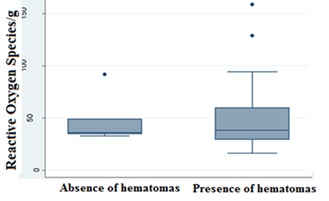 Figure 2: Results presented in Boxplot by the Kolmogorov-Smirnov Test, STATA 12®, for evaluation of the relationship between the ROS variables in the tissue/gram versus the absence and presence of hematomas.
The present study is the first performed in Brazil that relates pre-slaughter cattle stress with the detection of ROS, and its influence on meat quality. However, it is necessary to perform further studies to allow technical standardization, more clarity in the reading of results and the verification of a possible relationship between the factors of pre-slaughter stress, the presence of free radicals and meat quality
CONCLUSION
The distance and time taken by the animals to arrive at the cold storage slaughterhouses in the region of the Federal District and Surroundings and the rest time during which they remained in the slaughterhouse were not enough to influence their meat quality.
The results obtained in the organoleptic analyses of the meat indicated some variations in the evaluated parameters, however, the samples met the parameters considered for high-quality meat. Statistically, two trends were observed in the present study. According to the Kolmogorov-Smirnov, test analysis for the evaluation of the relationship between the variables of pH versus the absence or presence of hematoma, it was proved that the pH value can be affected by the presence of hematomas. Therefore, the results presented by the Kolmogorov-Smirnov test for the assessment of the relationship between the ROS variables in the tissue/gram versus absence and presence of hematomas, which demonstrated that the amount of reactive oxygen species in the muscle tissue can be influenced by tissues with hematomas.
No studies were found comparing the amount of pre-slaughter ROS in relation to stress and beef meat quality, thus requiring further studies in this area to verify whether there is a possible relationship between these parameters and whether they are correlated to stress.
REFERENCES
- ABIEC (2017) Report on Brazilian Beef Exports. Brazil
- Gomes RC, Feijó GLD, Chiari L (2017) Evolução e Qualidade da Pecuária Brasileira. EMBRAPA.
- Júnior DML, Rangel AHN, Urbano SA, Maciel MV, Amaro LPA (2011) Alguns Aspectos Qualitativos da Carne Bovina: Uma Revisão. Acta Veterinaria Brasilica 5: 351-358.
- Andrade PL, Bressan MC, Gama LT, Gonçalves TM, Ladeira MM, et al. (2010) Qualidade da carne maturada de bovinos Red Norte e Nelore1. Revista Brasileira de Zootecnia 39: 1791-1800.
- Kuss F, López J, Restle J, Barcellos JOJ, Moletta JL, et al. (2010) Qualidade da carne de novilhos terminados em confinamento e abatidos aos 16 ou 26 meses de idade. Revista Brasileira de Zootecnia 39: 924-931.
- Costa EC, Restle J, Brondani IL, Perottoni J, Faturi C, et al. (2002) Composição Física da Carcaça, Qualidade da Carne e Conteúdo de Colesterol no Músculo Longissimus dorsi de Novilhos Red Angus Superprecoces, Terminados em Confinamentoe Abatidos com Diferentes Pesos. Revista Brasileira de Zootecnia 31: 417-428.
- Klont RE, Barnier VM, Smulders FJ, Van Dijk A, Hoving-Bolink AH, et al. (1999) Post-mortem variation in pH, temperature, and colour profiles of veal carcasses in relation to breed, blood haemoglobin content, and carcass characteristics. Meat Sci 53: 195-202.
- Wheeler TL, Shackelford SD, Koohmaraie M (1997) Standardizing collection and interpretation of Warner-Bratzler shear force and sensory tenderness data. Proc Recip Meat Conf 50: 68-77.
- AMSA (2012) AMSA Meat Color Measurement Guidelines.
- Romero MH, Uribe-Velásquez LF, Sánchez JA, Miranda-de la Lama GC (2013) Risk factors influencing bruising and high muscle pH in Colombian cattle carcasses due to transport and pre-slaughter operations. Meat Sci 95: 256-63.
- Alves AR, Júnior JPF, Santana MHM, de Andrade MVM, Lima JBA, et al. (2016) Efeito do estresse sobre a qualidade de produtos de origem animal. Pubvet 10: 448-459.
- Morello MJ, Shahidi F, Ho CT (2002) Free Radicals in Food: Chemisty, Nutition, and Health Effects, Volume 807. American Chemical Society, Washington, D.C., USA.
- Chen X, Zhang L, Li Z, Feng Gao F, Zhou G (2017) Hydrogen peroxide-induced change in meat quality of breast muscle of broilers is mediated by ROS generation, apoptosis and autophagy in NF-#B signal pathway. J Agric Food Chem 65: 3986-3994.
- BRASIL (200) Instrução Normativa nº3, de 17 de janeiro de 2000. Dispõe sobre Regulamento Técnico de Métodos de Insensibilização para o Abate Humanitário de Animais de Aço Brasília.
- Cardoso CP, Silva BF, Gonçalves DS, TagliariI NJ, Saito ME, et al. (2014) Resistência contra ectoparasitas em bovinos da raça Crioula Lageana e meio-sangue Angus avaliada em condições Pesquisa Veterinária Brasileira 34: 141-146.
- Mrakic-Sposta S, Gussoni M, Montorsi M, Porcelli S, Vezzoli A (2014) A Quantitative Method to Monitor Reactive Oxygen Species Production by Electron Paramagnetic Resonance in Physiological and Pathological Conditions. Oxid Med Cell Longev 2014: 306179.
- Honikel KO (1998) Reference methods for the assessment of physical characteristics of meat. Meat Sci 49: 447-457
- Kim YH, Kemp R, Samuelsson LM (2016) Effects of dry-aging on meat quality attributes and metabolite profiles of beef loins. Meat Sci 111: 168-176.
- Gomes BRB, Firmino M, Jorge JS, Ferreira MLO, Rodovalho TM, et al. (2018) Increase of reactive oxygen species in different tissues during lipopolysaccharide-induced fever and antipyresis: An electron paramagnetic resonance study. Free Radical Research 52: 351-361.
- Berg K, Ericsson M, Lindgren M, Gustafsson H (2014) A high precision method for quantitative measurements of reactive oxygen species in frozen biopsies. PLoS One 9: 90964.
- Batista De Deus JC, Silva WP, Soares GJD (1999) Efeito da Distância de Transporte de Bovinos no Metabolismo post mortem. Bras de Agrociência 5: 152-156.
- BRASIL (1997) Regulamento Da Inspeção Industrial e Sanitária de Produtos De Origem Animal. Brasília.
- BRASIL (2017) Decreto nº 9.013, de 29 de março de 2017. Regulamenta a Lei nº 1.283, de 18 de dezembro de 1950, e a Lei nº 7.889, de 23 de novembro de 1989, que dispõem sobre a inspeção industrial e sanitária de produtos de origem animal. Brasília, 29 de março de 2017
- Knowles G (1999) Review of the road transport of cattle. Veterinary Record.
- Ludtke CB, Ciocca RFP, Dandin T, Ferrarini C (2012) Abate humanitário de bovinos– Rio de Janeiro: WSPA.
- Huertas SM, van Eerdenburg F, Gil A, Piaggio J (2015) Prevalence of carcass bruises as an indicator of welfare in beef cattle and the relation to the economic impact. Vet Med Sci 1: 9-15.
- Andrade EN, Silva RAMS, Roça RO, Silva LAC, Gonçalves HC, et al. (2008) Ocorrência de lesões em carcaças de bovinos de corte no Pantanal em função do transporte. Ciência Rural 38: 1991-1996.
- Bertoloni W, da Silva JL, de Abreu JS, Andreolla DL (2012) Bem-estar e taxa de hematomas de bovinos transportados em diferentes distâncias e modelos de carroceria no estado do Mato Grosso-Brasil. Revista Brasileira de Saúde e Produção Animal 13: 850-859.
- Adzitey F, Nurul H (2011) Pale soft exudative (PSE) and dark firm dry (DFD) meats: causes and measures to reduce these incidences - a mini review. International Food Research Journal 18: 11-20.
- Rubiano GAG, Arrigoni MB, Martins CL, Rodrigues E, Gonçalves HC, et al. (2009) Desempenho, características de carcaça e qualidade da carne de bovinos superprecoces das raças Canchim, Nelore e seus mestiços. Revista Brasileira de Zootecnia 38: 2490-2498.
- Fernandes ARM, Sampaio AAM, Henrique W, OliveiraI EA, Tullio RR, et al. (2008) Características da carcaça e da carne de bovinos sob diferentes dietas, em confinamento. Arquivo Brasileiro de Medicina Veterinária e Zootecnia 60: 139-147.
- Alves DD, Goes RHTB, Mancio AB (2005) Maciez da carne bovina. Ciência Animal Brasileira 6: 135-149.
- Horst EH, Neumann M, Leão GFM, Mareze J, Mareze M, et al. (2016) Aspectos que influenciam a maciez da carne de bovinos: Revisão. PUBVET 10: 721-794.
- Barcellos VC, Mottin C, Passetti RAC, Guerrero A, Eiras, CE, et al. (2017) Carcass characteristics and sensorial evaluation of meat from Nellore steers and crossbred Angus vs. Nellore bulls. Acta Scientiarum Animal Sciences 39: 437-448.
- Menezes LFG, Restle J, Vaz FN, Brondani IL, Filho DCA, et al. (2005) Composição Física da Carcaça e Qualidade da Carne de Novilhos de Gerações Avançadas do Cruzamento Alternado entre as Raças Charolês e Nelore, Terminados em Confinamento. Revista Brasileira de Zootecnia 34: 946-956.
- Muchenje V, Dzama K, Chimonyo M, Strydom PE, Raats JG (2009) Relationship between pre-slaughter stress responsiveness and beef quality in three cattle breeds. Meat Science 81: 653-657.
- Felício PE (1999) In: XXXVI Reunião Anual da SBZ. Porto Alegre. Anais. Rio Grande do Sul: Sociedade Brasileira de Zootecnia.
- Igarassi MS, Arrigoni MB, Hadlich JC, Silveira AC, Martins CL, et al. (2008) Características de carcaça e parâmetros de qualidade de carne de bovinos jovens alimentados com grãos úmidos de milho ou sorgo. Revista Brasileira de Zootecnia 37: 520-528.
- Strydom PE, Frylinck L, Smith MF (2011) Variation in meat quality characteristics between Sanga (Bos taurus africanus) and Sanga-derived cattle breeds and between Sanga and Brahman (Bos indicus). Animal 5: 483-491.
- Hopkins DL, Ponnampalam EN, van de Ven RJ, Warner RD (2014) The effect of pH decline rate on the meat and eating quality of beef carcasses. Animal Production Science 54: 407-413.
- Lage JF, Paulino PV, Filho SC, Souza EJ, Duarte MS, et al. (2012) Influence of genetic type and level of concentrate in the finishing diet on carcass and meat quality traits in beef heifers. Meat Sci 90: 770-774.
- Gadjeva V, Grigorov B, Nikolova G, Tolekova A, Zheleva A, et al. (2013) Protective effect of spin-labeled 1-ethyl-1-nitrosourea against oxidative stress in liver induced by antitumor drugs and radiation. Biomed Res Int 2013: 924870.
- Bolumar T, Andersen ML, Orlien V (2014) Mechanisms of radical formation in beef and chicken meat during high pressure processing evaluated by electron spin resonance detection and the addition of antioxidants. Food Chem 150: 422-428.
- Carmo TJ, Peripolli V, Júnior BGCJ, Tanure CB, Fioravanti MCS, et al. (2017) Carcass characteristics and meat evaluation of Nelore cattle subjected to different antioxidant treatments. Revista Brasileira de Zootecnia 46: 138-146.
- Gonçalves JR (2009) Qualidade da carne bovina (M. Semitendinosus) injetada, acondicionada em embalagem cook in e cozida sob diferentes regimes de cocção. 2009. 95 f. Tese (Doutorado em Tecnologia de Alimentos) - Faculdade de Engenharia de Alimentos,Universidade Estadual de Campinas, Campinas.
- IBGE (2016) Pesquisa trimestral de abate de animais.
- Linares E, Giorgio S, Mortara RA, Santos CXC, Yamada AT, et al. (2001) Role of peroxynitrite in macrophage microbicidal mechanisms in vivo revealed by protein nitration and hydroxylation. Free Radical Biology & Medicine 30: 1234-1242.
- Maganhini MB, Mariano B, Soares AL, Guarnieri PD, Shimokomaki M, et al. (2007) Carnes PSE (pale, soft, exudativa) e DFD (dark, firm, dry) em lombo suíno numa linha de abate industrial. Ciência e Tecnologia de Alimentos 27: 69-72.
- Melo AF, Moreira JM, Ataídes DS, Guimarães RAM, Loiola JL, et al. (2016) Fatores que influenciam na qualidade da carne bovina: Revisão. Revista Brasileira de Saúde e Produção Animal 13: 721-794.
- MINOLTA (1993) Precise color communication. Minolta Camera Co., Ltd. Japan.
- Ribeiro FG, Leme PR, Bulle MLM, de Lima CG, da Luz e Silva S, et al. (2002) Características da Carcaça e Qualidade da Carne de Tourinhos Alimentados com Dietas de Alta Energia. Revista Brasileira de Zootecnia 31: 749-756.
- Ricardo HA (2010) Resfriamento de carcaças de ruminantes. Pubvet 4: 114.
- Sousa GGT, Júnior SCS, Santos KR, Guimarães JEC, Luz CSM, et al. (2012) Características reprodutivas de bovinos da raça Nelore do meio Norte do Brasil. Pubvet Londrina 6: 1387-1392.
- Tsuhako MH, Augusto O, Linares E, Dagli ML, Pereira CA (2006) Association between nitric oxide synthesis and vaccination-acquired resistance to murine hepatitis virus by spf mice. Free Radic Biol Med 41: 1534-1541.
- Vaz FN, Restle J (2000) Aspectos Qualitativos da Carcaça e da Carne de Machos Hereford, Inteiros ou Castrados, Abatidos aos Quatorze Meses. Revista brasileira de zootecnia 29.
- Willis GR, Udiawar M, Evans WD, Blundell HL, James PE, et al. (2014) Detailed characterisation of circulatory nitric oxide and free radical indices-is there evidence for abnormal cardiovascular homeostasis in young women with polycystic ovary syndrome? BJOG 121: 1596-1603.
- Yao D, Vlessidis AG, Evmiridis NP, Zhou Y, Xu S, et al. (2002) Novel chemiluminescence method for detection of superoxide anions and its application to dry-cured meat. Analytica Chimica Acta 467: 145-153.
- Zhang W, Xiao S, Ahn DU (2013) Protein oxidation: Basic principles and implications for meat quality. Crit Rev Food Sci Nutr 53: 1191-1201.
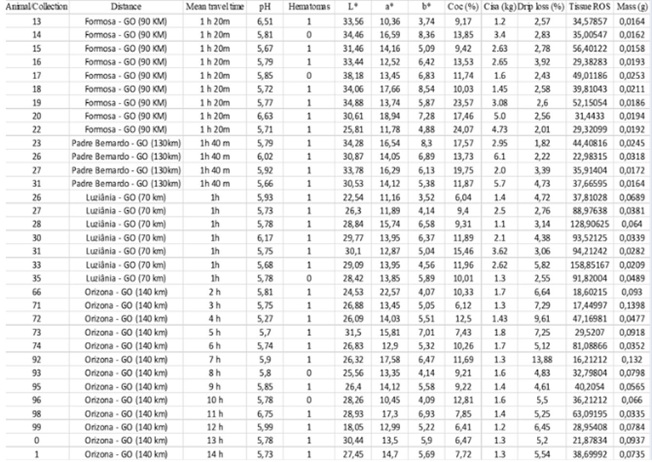
SUPPORT INFORMATION
Data table with all the performed collections
Citation: Leite TR, de Sousa CMZ, de Souza PEN, de Souza FHV, Gonçalves VSP, et al. (2020) Detection of Reactive Oxygen Species as a Possible Maker of Quality of Bovine Meat. J Food Sci Nutr 6: 061.
Copyright: © 2020 ThaísRezende Leite& , et al. This is an open-access article distributed under the terms of the Creative Commons Attribution License, which permits unrestricted use, distribution, and reproduction in any medium, provided the original author and source are credited.