Diagnostic Accuracy of WatchPAT versus Type 3 Portable Sleep Tests for Obstructive Sleep Apnea
*Corresponding Author(s):
Daniel ReisCentro Hospitalar De Vila Nova De Gaia E Espinho, EPE, Rua Conceição Fernandes, Vila Nova De Gaia, Portugal
Tel:+351 227865100,
Email:daniel.reis91@hotmail.com
Abstract
Introduction
Obstructive Sleep Apnea (OSA) is a common sleep-related breathing disorder with important healthcare consequences. There has been increasing interest in portable Home Sleep Apnea Testing (HSAT) devices. Type 3 HSAT (T3HSAT) and WatchPAT (WP) devices can be used for obstructive sleep apnea diagnosis in unattended home environment. The aims of this study are to compare WP and T3HSAT device regarding the diagnostic accuracy and OSA severity stratification, and to assess the predictive performance of the STOP-Bang questionnaire for each sleep study type.
Method
Double-blind, cross-sectional cohort study. Forty-nine patients performed a T3HSAT and WP recording simultaneously in unattended home setting. T3HSAT events were manually scored using AASM criteria; WP data were collected and analyzed by anautomatic algorithm. Results from both tests were compared.
Results
There were no statistically significant differences between median AHI in T3HSAT and WP. We also found a strong correlation between the different parameters evaluated by T3HSAT and WP: AHI (r=0.829, p<0.001), minimum oxygen saturation (r=0.839, p<0.001), oxygen saturation < 90% (r=0.771, p<0.001) and mean heart rate (r=0.990, p<0.001). Furthermore, the level of agreement between WP and T3HSAT regarding OSA diagnosis and severity was high (Kendall tau-b = 0,715, p<0,001). Using an AHI ≥ 5 cutoff, the STOP-BANG score ≥ 3 had a sensitivity of 82.6% and specificity of 33.3% in T3HSAT and 83.3% and 21.1% in WP, respectively.
Conclusion
WP performance in OSA diagnosis and stratification is similar to T3HSAT which makes it a useful diagnostic option for patients with suspected OSA. Larger studies are needed to confirm these results and to compare cost-effectiveness of both devices.
Keywords
Ambulatory monitoring; Home sleep testing; Obstructive sleep apnea; Sleep apnea; Sleep disorders
Introduction
Obstructive Sleep Apnea (OSA) is a common sleep-related breathing disorder characterized by recurrent episodes of complete or partial upper airway obstruction occurring during sleep leading to intermittent hypoxemia, hypercapnia, frequent arousals, fragmented sleep, intrathoracic pressure swings, and increased sympathetic nervous system activity [1-3]. Patients with OSA may have daytime sleepiness and impaired concentration, cognitive function, social interactions and quality of life [2,3]. In addition, OSA has been associated with a wide range of comorbidities, including cardiovascular, cerebrovascular and metabolic disorders [4-6]. Therefore, early diagnosis and proper treatment of OSA is crucial to improve symptoms and reduce associated risks.
The gold standard for OSA diagnosis is in-laboratory Polysomnography (PSG) [3]. However, PSG is an expensive, complex and cumbersome study with limited availability and long waiting lists. Home Sleep Apnea Testing (HSAT) devices are a valid alternative in selected patients and may be less costly. Stop-BANG score is a simple and easy tool to assess OSA pretest probability. Firstly applied to patients undergoing surgery, it is now widely used to predict OSA and, as such, may help to decide what type of diagnostic test to conduct.
Portable HSAT devices have been classified in type 2, 3 and 4, according to the monitor sensors used. Type 3 HSAT devices (T3HSAT), which record limited cardiopulmonary parameters (pulse oximetry, airflow, respiratory effort and heart rate/electrocardiogram), have been widely used. Yet, the use of Total Recording Time (TRT) as the respiratory event index denominatoris one major limitation of T3HSAT since it may overestimate this measure and, thus, underestimate OSA severity [7].
The WatchPAT (WP) is a wrist-worn ambulatory sleep recorder, recommended by the American Academy of Sleep Medicine (AASM) for HSAT that uses Peripheral Arterial Tonometry (PAT), pulse rate, actigraphy and pulse oximetry to assess respiratory disturbances [8]. There are several studies supporting its validity and reliability based on the high degree of agreement between WP and PSG indices, particularly regarding the Respiratory Disturbance Index (RDI) and Apnea/Hypopnea Index (AHI) [9-12]. In addition, it can provide information about Total Sleep Time (TST), sleep stages and has algorithms that are able to detect Central Sleep Apnea (CSA) [13-15].
To the best of our knowledge there are no studies comparing diagnostic performance between T3HSAT devices and a sleep study performed with WP, both carried out in a home environment. Furthermore, there is no study evaluating the predictive performance of the STOP-Bang score applied to the WP device.
Our aim is to compare the diagnostic accuracy and OSA severity stratification between WP and a T3HSAT device. Moreover, we assessed the predictive performance of the STOP-Bang questionnaire for each sleep study type.
We present the following article in accordance with the STROBE checklist.
Methods
Study design
We conducted a double-blind, cross-sectional cohort study at a private hospital in Vila Nova de Gaia, Portugal.
Sample selection
The study included patient’s ≥ 18 years old with suspected OSA. Patients were consecutively included between March and May 2019. Exclusion criteria were: suspicion of non-respiratory sleep disorders; use of alpha-adrenergic antagonists, use of short-acting nitrates (less than 3 hours before the study), cardiac arrythmias and implanted pacemaker.
Randomization and blinding
A paired randomization table using integer, non-duplicate numbers ranging from 1 to 100 (for T3HSAT) and 101 to 201 (for WP) was created. The final paired randomization table was only known to author C.V. which allocated each selected patient to a pair of numbers.
Two independent teams of physicians and sleep technicians have analyzed T3HSAT and WP results. Both teams were unaware of other team test results. Blinding was opened by C.V. at the end of the study.
Data collection
A questionnaire was applied to every patient by a medical doctor. This questionnaire included, among other items, the patient’s demographic and anthropometric data, smoking status, comorbidities, medication, STOP-BANG score and Epworth Sleepiness Scale (ESS) - Portuguese versions.
Each participant performed a T3HSAT (Alice PDX, Philips Respironics) and WP (WP200, Itamar Medical Ltd.) recording simultaneously in unattended home setting. Alice PDX records pulse oximetry, pulse rate (from the oximeter probe), airflow (pressure-based airflow with snore detection through a nasal cannula), respiratory inductive plethysmography and body position. WP monitors PAT signal, oxygen saturation, heart rate, actigraphy, snoring, and body position.
T3HSAT results were manually scored by one skilled technician according to The American Academy of Sleep Medicine (AASM) scoring rules [16]. An apnea was defined as an air-flow reduction ≥ 90% for a minimum of 10 seconds and a hypopnea was defined as airflow reduction of 30%-90% from baseline, lasting at least 10 seconds and associated with either a >3% oxygen desaturation or an arousal.
WP sleep test results were automatically analyzed with zzzPat® software. A previous version of the WP algorithm has already been described [13]. In summary, the WP defines respiratory events by pulse oximetry desaturations of ≥ 4% and surges in sympathetic nervous system activity that results in PAT amplitude reduction and concomitant increases in heart rate.
For respiratory indices calculations, T3HSAT uses TRT and WP uses TST.
The study protocol was approved by the local ethics committees and all patients gave written informed consent. The authors are accountable for all aspects of the work in ensuring that questions related to the accuracy or integrity of any part of the work are appropriately investigated and resolved.
Statistical Analysis
Continuous variables were reported as mean and Standard Deviation (SD) or median and range. Normality distribution was evaluated through the Kolmogorov-Smirnov test. Categorical variables were presented as frequency and percentage. We used the Wilcoxon sign test for comparison of the respiratory indices between the two groups (T3HSAT and WP). Spearman correlation tests were used to compare AHI, minimum oxygen saturation, time below 90% O2 saturation and mean heart rate between WP and T3HSAT. Bland-Altman plots and Kendall tau-b were applied to evaluate the agreement of AHI between the two devices. The predictive performance of the STOP-Bang questionnaire was also analysed in the two groups.
All statistical analyses were carried out using the SPSS 23.0 package program. The significance level was set at 0.05.
Results
Study population
A total of 54 patients with suspected OSA were enrolled and 5 (9%) were excluded due to lack of technical quality with WP studies. Demographic and clinical characteristics of the patients are presented in table 1. Most of the patients were male (71.4%) and presented comorbidities (81.6%). Their mean age was 54±10 years old and the Body Mass Index (BMI) was 28.3±4.1Kg/m2. Most patients presented a STOP-BANG score ≥ 3 (81.6%) and 34.7% scored more than 10 points on the ESS.
|
Total (n = 49) |
|
|
Male, n (%) |
35 (71.4) |
|
Age (years, mean ± SD) |
54±10 |
|
Smoking status, n (%) |
|
|
Current smoker |
5 (10.2) |
|
Former smoker |
17 (34.7) |
|
Never smoker |
27 (55.1) |
|
Comorbidities, n (%) |
|
|
Dyslipidemia |
19 (39.8) |
|
Obesity |
16 (32.7) |
|
Arterial hypertension |
12 (24.5) |
|
Type 2 diabetes mellitus |
4 (8.2) |
|
Asthma |
3 (6.1) |
|
Chronic obstructive pulmonary disease |
1 (2.0) |
|
Aortic aneurysm |
1 (2.0) |
|
Previous stroke |
1 (2.0) |
|
Neck circumference (cm, mean ± SD) |
39.5 ± 3.8 |
|
Drugs, n (%) |
|
|
Benzodiazepines |
5 (10.2) |
|
Opioids |
1 (2.0) |
|
Alcohol abuse, n (%) |
2 (4.1) |
|
Mallampati score, n (%) |
|
|
1 |
5 (10.2) |
|
2 |
11 (22.4) |
|
3 |
16 (32.7) |
|
4 |
17 (34.7) |
|
STOP-Bang score ≥ 3, n (%) |
40 (81.6) |
|
Epworth Sleepiness Scale > 10, n (%) |
17 (34.7) |
|
cm: Centimeters; SD: Standard Deviation |
|
Table 1: Patients’ characteristics
Comparison between T3HSAT and WP results
The median AHI in T3HSAT was 16.0/h (range 2-82) and 17.4 /h (range 2-65) in WP (p=0.102). An AHI ≥ 5 was observed in 46 patients (93.9%) in T3HSAT and in 43 patients in WP (87.8%) (p=0.453). The Oxygen Desaturation Index (ODI), the mean and minimum oxygen saturation and the oxygen saturation < 90% was significantly lower in WP (p < 0.001). Table 2 summarizes the WP and T3HSAT findings.
|
T3HSAT |
WP |
Difference (T3HSAT-WP) |
P value |
|
|
AHI (events/hour), median (minimum-maximum) |
16.0 (2 - 82) |
17.4 (2 - 65) |
-2.1 (-17.9-18.4) |
0.102 |
|
ODI (events/hour), median (minimum-maximum) |
16.1 (1.8-78.4) |
5.4 (0.3-54.9) |
-9 (-27-0.6) |
<0.001 |
|
Mean oxygen saturation (%),median (minimum-maximum) |
93 (86-96) |
94 (89-97) |
1 (-1-3) |
<0.001 |
|
Minimum oxygen saturation (%),median (minimum-maximum) |
83 (53-94) |
87 (56-93) |
2 (-1-35) |
<0.001 |
|
Oxygen saturation < 90% (min), median (minimum-maximum) |
8 (0-437.7) |
1.4 (0-251.3) |
-6.4 (-327.5-3.9) |
<0.001 |
|
AHI: Apnea/Hypopnea Index; T3HSAT: Type 3 Home Sleep Apnea Testing; min: Minutes; WP: WatchPAT |
||||
Table 2: WP and T3HSAT results.
There was a strong correlation between T3HSAT and WP regarding the following variables: AHI (r=0.829, p<0.001), minimum oxygen saturation (r=0.839, p<0.001), oxygen saturation < 90% (r=0.771, p<0.001) and mean heart rate (r=0.990, p<0.001) (Figures 1 & 2).
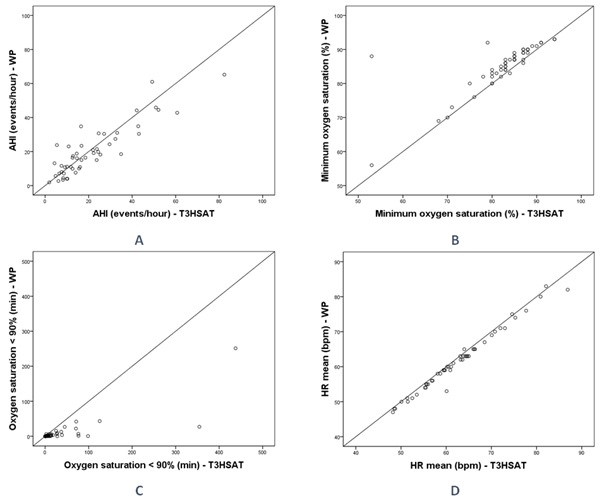 Figure 1: Scatter plot of AHI (A), minimum oxygen saturation (B), oxygen saturation < 90% (C) and HR (D) of WP and T3HSAT.
AHI: Apnea/Hypopnea Index; bpm: Beats per Minute; HR: Heart Rate; T3HSAT: Type 3 Home Sleep Apnea Testing; min: minutes; WP: WatchPAT
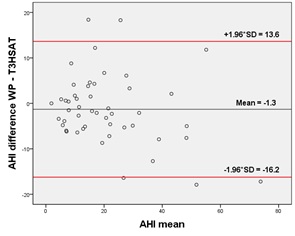 Figure 2: Bland-Altman plots of differences in the AHI between the two methods. The black line represents the mean paired difference and the red lines the 95% limits of agreement Statistical comparison of the difference with 0 gave a p value of 0.238.
AHI: Apnea/Hypopnea Index; T3HSAT: Type 3 Home Sleep Apnea Testing; SD: Standard Deviation; WP: WatchPAT
The Bland-Altman plot (Figure 2) illustrates the AHI difference between WP and T3HSAT for each patient. The overall mean difference between WP and T3HSAT was -1.3 ± 7.6 events/h.
The level of agreement between WP and T3HSAT regarding OSA diagnosis and severity was high (Kendall tau-b = 0.715, p<0.001) (Table 3). WP diagnosed OSA and rated its severity identically to T3HSAT in 29 (59%) patients. In 5 patients (10%), WP ruled out OSA and T3HSAT identified mild OSA. In two patients (4%) the opposite happened - WP identified mild OSA and T3HSAT excluded it. Of those 7 patients, only 2 had an Epworth Sleepiness Scale > 10 (1 patient diagnosed with mild OSA through WP and the other through T3HSAT).
|
T3HSAT |
||||||
|
AHI < 5 |
5 ≤ AHI < 15 |
15 ≤ AHI < 30 |
AHI ≥ 30 |
Total |
||
|
WP |
AHI < 5 |
1 |
5 |
0 |
0 |
6 (12.3%) |
|
5 ≤ AHI < 15 |
2 |
9 |
2 |
0 |
13 (26.5%) |
|
|
15 ≤ AHI < 30 |
0 |
6 |
10 |
2 |
18 (36.7%) |
|
|
AHI ≥ 30 |
0 |
0 |
3 |
9 |
12 (24.5%) |
|
|
Total |
3 (6.1%) |
20 (40.8%) |
15 (30.6%) |
11 (22.5%) |
49 (100%) |
|
|
AHI: Apnea/Hypopnea Index; T3HSAT: Type 3 Home Sleep Apnea Testing; WP: WatchPAT |
||||||
Table 3: Agreement between WP and T3HSAT regarding sleep apnea syndrome diagnosis and severity classification.
Performance of STOP-BANG questionnaire as a screening tool of OSA for T3HSAT and WP
Using an AHI ≥ 5 cutoff, the STOP-BANG score ≥ 3 had a sensitivity of 82.6% and specificity of 33.3% inT3HSAT and 83.3% and 21.1% in WP, respectively.
Discussion
Our study showed that the WP results are similar to those of T3HSAT and can be a useful diagnostic option for patients with suspected OSA.
Obviously, PSG is still the gold standard for OSA diagnosis but it is considered technically complex, expensive and time-consuming, which may contribute to OSA under diagnosis [17], with health and social consequences which results in significant economic burden [18]. The use of portable monitoring devices in selected patients is a simpler and less expensive alternative that allows a faster OSA diagnosis in home environment [19]. In the recent years, there has been clinical research demonstrating the accuracy and feasibility of WP for OSA diagnosis, comparing it with PSG [9-12]. However, in clinical practice, it is frequent to perform T3HSAT and so it is important for clinicians to understand how WP results correlates with T3HSAT results.
First, we highlight that we found a strong correlation between AHI from both devices (r=0.829, p<0.001), and no significant difference between median AHI of WP and T3HSAT. This was similar to the results of a previous meta-analysis of 14 studies that compared WP to PSG [12]. They found a strong correlation between AHI from WP and PSG (r = 0.899 [95% CI, 0.862-0.927; P <0.001]), but of all included studies, only one had compared WP and PSG in the unattended home setting.
The discrepancies found in AHI between two devices compared in this study may be due to technical differences regarding respiratory events identification, as explained above. In addition, the denominator used to calculate de AHI is the TST in WP and the TRT in the T3HSAT. Nevertheless, there was a good agreement between WP and T3HSAT regarding OSA diagnosis and severity classification. If we use a WP for OSA screening, 10% of patients will not be diagnosed with OSA and would have had this diagnosis if T3HSAT was used; the opposite happens in 4% of patients. As the gold standard (PSG) was not performed, it is difficult to know which device under- or over-diagnoses OSA. However, whenever there was disagreement in the diagnosis of OSA, it was between the absence of OSA and the diagnosis of mild OSAS, which has few treatment implications for most of those patients.
Regarding the oxygen indices, we verified statistically significant differences in ODI, mean and minimum oxygen saturation and oxygen saturation < 90% between the two devices. The ODI differences are probably related to different desaturation criteria (≥ 3% in T3HSAT and ≥ 4% in WP). However, this is unlikely to have clinical impact since there is considerable evidence that respiratory events linked to arterial oxygen desaturation of either ≥ 3 or 4% identified individuals at increased risk of cardiovascular consequences [20].
The differences in minimum oxygen saturation are probably related to device signal processing. In fact, previous studies assessing the performance characteristics of individual oximeter has demonstrated that due to differences in internal signal processing, there is significant variability in the SatO2 values obtained in sleep tests [21]. According to current guidelines, this variation has no clinical implications in the treatment decision. However, attempts have been made to identify some phenotypes among OSA patients [22,23] and if they include the minimum SatO2, it may have an impact on the treatment decision.
The clinical relevance of differences in mean and oxygen saturation < 90% between the two devices is questionable, since they are very small.
Regarding the STOP-Bang questionnaire, it has been validated to screen OSA as in the initial validation study, a score ≥ 3 had a sensitivity of 83.6% to detect all OSA (AHI ≥ 5) [24]. In our study, we further evaluate the performance of STOP-Bang questionnaire in predicting OSA, depending on the equipment used. The STOP-Bang questionnaire seems to be a good screening tool to identify patients with high risk of OSA regardless the device used for diagnosis, as sensitivity was similar for WP and T3HSAT, and comparable to the results obtained in the initial validation study.
Interestingly, most patients included in this study had at least one comorbidity, many of them with cardiovascular risk factors and this is likely to represent the population that clinicians would have to screen in clinical practice.
Despite these important results, we must consider some limitations of the study. First, the interpretation of our results is limited due to the reduced number of participants in this study.
Second, in this study, 5 patients were excluded due to lack of technical quality with WP studies. Sleep tests were performed in home environment, what may have contributed for that technical problem. Nevertheless, as WP is a simple and cheap test it can be easily repeated if necessary. Lastly, WP events scoring were not done manually, but it has been shown its unique ability among HSAT devices to render a fully automated, validated report, which compares extraordinarily well to gold standard polysomnography [13].
Conclusion
In conclusion, both WP and T3HSAT are adequate for OSA diagnosis in unattended home setting with similar diagnostic accuracy between them. In addition to the conventional sleep apnea indices, WP also measures sleep architecture (total sleep time, REM and NREM sleep time), which can be an advantage.
Additional studies to compare WP and other portable monitoring devices should include more participants. Furthermore, it will be important to address the cost-effectiveness of WP device in order to support the clinician decision when prescribing a HSAT.
Declarations of Interest
All authors have completed the ICMJE uniform disclosure form. The authors have no conflicts of interest to declare.
Funding Information
This work had the support of Gasoxmed.
Gasoxmed had no involvement in the study design, in the collection, analysis and interpretation of data and neither in the preparation of this article.
Ethical Statement
The authors are accountable for all aspects of the work in ensuring that questions related to the accuracy or integrity of any part of the work are appropriately investigated and resolved. The study protocol was approved by the local ethics committees and all patients gave written informed consent.
Author’s contributions
- Conception and design: Margarida Dias, Nuno Cortesão
- Administrative support: Analine Moura, Carla Vieira, Elsa Miranda, Pedro Martins
- Provision of study materials or patients: Analine Moura, Carla Vieira, Elsa Miranda, Margarida Dias, Nuno Cortesão, Pedro Martins
- Collection and assembly of data: Analine Moura, Carla Vieira, Elsa Miranda, Pedro Martins
- Data analysis and interpretation: Daniel Reis, Margarida Dias, Nuno Cortesão
- Manuscript writing: All authors
- Final approval of manuscript: All authors
References
- Sateia MJ (2014) International classification of sleep disorders-third edition: Highlights and modifications. Chest 146: 1387-1394.
- Epstein L, Weiss W (1998) Clinical consequences of obstructive sleep apnea. Semin Respir Crit Care Med 19: 123-132.
- Kapur VK, Auckley DH, Chowdhuri S, Kuhlmann DC, Mehra R, et al. (2017) Clinical practice guideline for diagnostic testing for adult obstructive sleep apnea: An american academy of sleep medicine clinical practice guideline. J Clin Sleep Med 13: 479-504.
- Budhiraja R, Budhiraja P, Quan SF (2010) Sleep-disordered breathing and cardiovascular disorders. Respir Care 55: 1322-1332.
- Shahar E, Whitney CW, Redline S, Lee ET, Newman AB, et al. (2001) Sleep-disordered breathing and cardiovascular disease: Cross-sectional results of the sleep heart health study. Am J Respir Crit Care Med 163: 19-25.
- Lam JC, Mak JC, Ip MS (2012) Obesity, obstructive sleep apnoea and metabolic syndrome. Respirology 17: 223-236.
- Bianch MT, Goparaju B (2017) Potential underestimation of sleep apnea severity by at-home kits: Rescoring in-laboratory polysomnography without sleep staging. J Clin Sleep Med 13: 551-555.
- Bar A, Pillar G, Dvir I, Sheffy J, Schnall RP, et al. (2003) Evaluation of a portable device based on peripheral arterial tone for unattended home sleep studies. Chest 123: 695-703.
- O’Brien LM, Bullough AS, Shelgikar AV, Chames MC, Armitage R, et al. (2012) Validation of Watch-PAT-200 against polysomnography during pregnancy. J Clin Sleep Med 8: 287-294.
- van de Water AT, Holmes A, Hurley DA (2011) Objective measurements of sleep for non-laboratory settings as alternatives to polysomnography--a systematic review. J Sleep Res 20: 183-200.
- Yuceege M, Firat H, Demir A, Ardic S (2013) Reliability of the Watch-PAT 200 in detecting sleep apnea in highway bus drivers. J Clin Sleep Med 9: 339-344.
- Yalamanchali S, Farajian V, Hamilton C, Pott TR, Samuelson CG, et al. (2013) Diagnosis of obstructive sleep apnea by peripheral arterial tonometry: Meta-analysis. JAMA Otolaryngol Head Neck Surg 139: 1343-1350.
- Weimin L, Rongguang W, Dongyan H, Xiaoli L, Wei J, et al. (2013) Assessment of a portable monitoring device WatchPAT 200 in the diagnosis of obstructive sleep apnea. Eur Arch Otorhinolaryngol 270: 3099-30105.
- Hedner J, Pillar G, Pittman SD, Zou D, Grote L, et al. (2004) A novel adaptive wrist actigraphy algorithm for sleep-wake assessment in sleep apnea patients. Sleep 27: 1560-1566.
- Pillar G, Berall M, Berry R, Etzioni T, Shrater N, et al. (2020) Detecting central sleep apnea in adult patients using WatchPAT-a multicenter validation study. Sleep Breath 24: 387-398.
- Berry RB, Albertario CL, Harding SM (2018) The AASM manual for the scoring of sleep and associated events. American Academy of Sleep Medicine, N Frontage RdDarien, IL, USA.
- Benjafield AV, Ayas NT, Eastwood PR, Heinzer R, Mary SMIp, et al. (2019) Estimation of the global prevalence and burden of obstructive sleep apnoea: A literature-based analysis. Lancet Respir Med 7: 687-698.
- Knauert M, Naik S, Gillespie MB, Krygera M (2015) Clinical consequences and economic costs of untreated obstructive sleep apnea syndrome. World J Otorhinolaryngol Head Neck Surg 1: 17-27.
- Nilius G, Domanski U, Schroeder M, Franke KJ, Hogrebe A, et al. (2017) A randomized controlled trial to validate the Alice PDX ambulatory device. Nat Sci Sleep 9: 171-180.
- Berry RB, Budhiraja R, Gottlieb DJ, Gozal D, Iber C, et al. (2012) Rules for scoring respiratory events in sleep: Update of the 2007 AASM manual for the scoring of sleep and associated events. Deliberations of the sleep apnea definitions task force of the american academy of sleep medicine. J Clin Sleep Med 8: 597-619.
- Ng Y, Joosten SA, Edwards BA, Turton A, Romios H, et al. (2017) Oxygen desaturation index differs significantly between types of sleep software. J Clin Sleep Med 13: 599-605.
- Labarca G, Campos J, Thibaut K, Dreyse J, Jorquera J (2019) Do T90 and SaO 2 nadir identify a different phenotype in obstructive sleep apnea? Sleep Breath 23: 1007-1010.
- Randerath WJ, Herkenrath S, Treml M, Grote L, Hedner J, et al. (221) Evaluation of a multicomponent grading system for obstructive sleep apnoea: The Baveno classification. ERJ Open Res 7: 00928-2020.
- Chung F, Yegneswaran B, Liao P, Chung SA, Vairavanathan S, et al. (2008) STOP questionnaire: A tool to screen patients for obstructive sleep apnea. Anesthesiology 108: 812-821.
Citation: Reis D, Moura A, Vieira C, Miranda E, Martins P, et al. (2022) Diagnostic Accuracy of WatchPAT versus Type 3 Portable Sleep Tests for Obstructive Sleep Apnea. J Pulm Med Respir Res, 2022, 8: 071.
Copyright: © 2022 Daniel Reis, et al. This is an open-access article distributed under the terms of the Creative Commons Attribution License, which permits unrestricted use, distribution, and reproduction in any medium, provided the original author and source are credited.