Does The Collaboration Between Clean Energy, Stock Market Development, And International Investment Abate CO2 Emission? Insight from Cyprus
*Corresponding Author(s):
Benjamin Ampomah AsieduFaculty Of Economics And Administrative Sciences, Cyprus International University Nicosia, North Cyprus & Valley View University, Faculty Of Accounting And Finance, Ghana, West Africa
Email:asieduampomab@gmail.com
Abstract
The study sought to determine whether the collaboration between clean energy, Stock market development, and international investment, abate CO2 emissions in Cyprus. Our study employed descriptive statistics and correlation to know the normality and multicollinearity of the variables. ADF validated the stationarity of the variables. Per the short-run ARDL model, rising foreign direct investment can decrease CO2 emissions as the economy experiences growth, CO2 emissions increase in the short term. Renewable energy consumption decreases CO2 emissions in the short run. The stock market positively relates to co2 emission in the short run. Per the Durbin Watson value, the model is free from serial correlation. Nevertheless, in the long run, ARDL revealed that foreign direct investment is negatively related to CO2 in the long run. Renewable energy negatively impacted CO2 emissions in the long run. The stock market positively influences CO2 emissions. The Error Correction Model revealed a 16.6% high speed of adjustment from the short run to the long run. The bound test validated a long-run equilibrium relationship between the dependent and the independent variables. The study prompted many policy directions for Cyprus.
Keywords
Clean energy; Economic growth; Environmental pollution; International investment; Stock market
Introduction
Global clean energy capacity growth in twenty-twenty exceeded previous expectations and records despite the economic downturn caused by Covid 19 epidemic. Per the international Clean Energy Agency-IRENA, the globe acquired more than two hundred and sixty-gigawatt clean energy last year, over fifty percent more than in 2019 [1]. Following specific figures worldwide, from 2009, total clean energy recorded 1135599GW, in 2010 clean energy increased to 122335, in 2011 it increased to 1329886, in 2012 clean energy increased to 11442763, in 2013 it increased to 1564390, in 2014, clean energy increased to 1694061GW, in 2015 it improved to 1847258, in 2016 clean energy production increased to 2010005, in 2017 it increased to 2180389, in 2018 clean energy increased to2358749, in 2019 clean energy increased to2538441 and in 2020 clean energy increased to 2799094. Worldwide clean energy production experienced remarkable growth per (Figure 1).
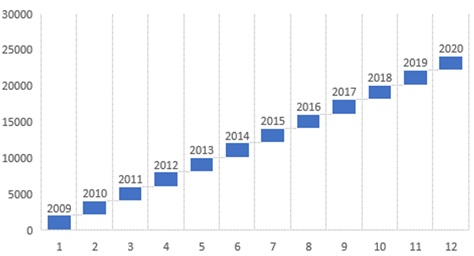 Figure 1: World Total Renewable energy capacity.
In Europe from 2009, total clean energy recorded 814713MW, in 2010 clean energy increased to 8898824, in 2011 it increased to 360883, in 2012 clean energy increased to 395154, in 2013 clean energy improved to 419914, in 2014 it increased to 440774, in 2015 clean energy increased to 465057, in 2016 it increased to 488578, in 2017 clean energy production increased to 512890, in 2018 it increased to 537570, in 2019 clean energy increased to 575167 and in 2020 clean energy augmented to 609499. In Europe, clean energy production experienced tremendous growth, per (Figure 2).
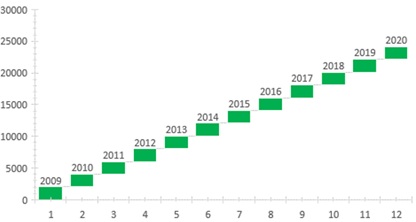 Figure 2: Europe Total Renewable energy capacity.
Source: IRENA 2022
Cyprus, the treasure of the eastern Mediterranean, is endowed with lush plains, endless sunshine, steep mountains, and magnificent beaches, and its stunning landscape begs to be preserved. Switching to clean energy sources is one of the effective methods to keep the environment secure (RES). The European policy target for twenty-twenty outlines Cyprus's issue. These encompass the growth of local resources, improved energy supply security, increased competitiveness, and environmental security. Cyprus must achieve a clean energy share of thirteen percent (13%) in its total final energy utilization in this project.
Since 2019 Cyprus increased total clean energy to 12MW. In 2010, clean energy increased to 97; in 2011, it increased to 153; in 2012, clean energy increased to 173. In 2013, clean energy improved to 192. In 2014, it increased to 221. In 2015 clean energy increased to 244. In 2016 it increased to 252; in 2017, clean energy production increased to 289. In 2018 it increased to 322; in 2019, clean energy increased to 322; and in 2020, clean energy augmented to 371. In Cyprus, clean energy production recorded incredible growth per (Figure 1).
Cyprus-Energy-Regulatory-Authority (CERA) came into action focusing on comprehensive energy market reforms, which was completed in twenty-twenty-one. The goal is to give customers a supplier choice and urge the private sector to generate clean energy for commercial uses. In this regard, in 2017, a revised scheme was launched, which was later updated in 2018 purposely to encourage the installation of P.V. systems up to eight M.W., wind systems up to seventeen point five M.W., and biomass usage systems up to five M.W.
Due to the European Union’s clean energy directives binding requirements, a shortfall of thirteen percent in clean energy output might result in hefty fines assessed daily. Even though the daily punishment is determined, the European Commission has proposed a fine of EUR11, 404.80 a day until the required percentage of clean energy is achieved. Cyprus appears to recognize the directive's legal force since the administration declared that a total of EUR59 has been allocated to energy subsidies in the 2019 budget, with roughly EUR30 million going directly to clean energy generation.
Despite all these attempts, Cyprus is the most reliant on fossil fuels among European Union countries, posing a significant challenge. Presently, imported conventional energy provides just under ninety percent of the country's energy needs, accounting for up to eight percent of total economic growth. The novelty of this study is that it is one of its kind. No topic of this nature has been done in Cyprus. Similar to this study is [2]. This study follows the current methodology by adding a new approach such as the ARDL approach contrarily to [2]. The only research highlights much on the stock market's pertinent international investment and clean energy ensuring environmental quality in Cyprus. The above background necessitated the study to find the answer is to ''Does the collaboration between Clean energy, Stock market development, and international investment abate CO2 emission in Cyprus?'. The study is organized into five parts the introduction section, the methodology section, data presentation, analysis-discussion, conclusion, and policy directions.
Brief Literature Review
The literature is divided into three sections. Thus the connection between renewable energy and CO2 emissions, Stock market development and CO2 emissions, international investment, and CO2 emissions.
Renewable Energy and CO2 Emissions
[3] Study the interrelationship between clean and non-renewable energy use, CO2 emission, and growth in twenty-six European nations. The information was gathered from WDI and covered the period from 1990 to 2018. The outcome granger causality shows a long-term connection between clean, non-renewable energy, co2, and economic expansion. The findings from this study contradict the findings of others, although they suggest a unidirectional causation relation between renewable energy and co2. The result indicates that clean energy and non-renewable energy sources are interdependent and interchangeable. At the same time, [4] study aims to examine the STIROAT model's applicability in assessing carbon dioxide emissions from OECD nations from 1980 to 2011. According to the empirical findings, renewable energy usage correlates with decreased co2 emissions. At the same time, [5] study outcome indicated that renewable energy contributes significantly to CO2 emissions in the SSEA regions. Furthermore, the empirical results indicate that middle-income nations are experiencing a substantial increase in clean energy/fossil fuel energy consumption, resulting in greenhouse emissions in the SSEA regions. Also, [6] also examines the interplay between renewable energy uses, economic growth, and co2 emissions. In other to carry out the analysis, the author has utilized the structural VAR method. A unit root test of the variables in question shows that they are non-stationary at their level and stationary in the first difference form. The study findings show that as clean energy use is bolstered, GDP rises, and co2 emissions fall. The variance decomposition highlights the importance of using clean energy sources in reducing the forecast error variance of economic growth and carbon dioxide emissions. Correspondingly, [7], utilizing the ARDL bound testing approach, explored the lonk of co2 emission on population growth, foreign investment, and clean energy in Pakistan. Causal relation was checked with the aid of the pairwise Granger causality method. Findings expressed that co2 emission has an adverse link with clean energy. Adding more, [8] examine the impact of renewable energy and non-renewable energy consumption real income on CO2 emissions evidence from structural breaks test. The studied variable became stationary at the first difference, according to the Zivot-Andrews unit rot test with structural breaks. Co2 and renewable energy are cointegrated according to the Gregory-Hansen cointegration test with structural breaks. Improvement in renewable energy usage alleviates environmental according to the ARDL model's long-run projection.
International Investment and CO2 emission
[9] Looked at how economic policy uncertainty and FDI direct investment impacted CO2 emissions in 24 industrialized and developing nations from 2001 to 2019. Following cross-section dependency and cointegration check, Granger causality approaches as dynamic seemingly unrelated regression and panel vector error correction model are employed for long-run estimates and validate the causal relationship between variables. Conversely, a one percent rise in international investment is related to a decrease in CO2 emissions. Likewise, [7] utilizing the ARDL bound testing approach and Granger causality approach, analyzed the dynamic interaction of co2 emission on population growth, foreign investment, and renewable energy in Pakistan. The result exposed that FDI and population growth has significant positive interactions with co2 emission, which means that a stringent benchmark is needed from the government of Pakistan to improve the economy's growth via the demonization of carbon dioxide emission. [10] Selected a panel of belt and road initiative nations from 1990 to 2017 to investigate the role of FDI and globalization on co2 via the channel of energy usage. According to the dynamic seemingly unrelated regression, FDI does not predict co2 in the long run. This means that international investment lessens environmental repercussions with reduced co2 emissions. [11] Examine the nexus between Turkey's foreign trade and CO2 emissions. The study employed linear and nonlinear ARDL models and identified significant asymmetric effects of import, export, and FDI on CO2. Nevertheless, FDI has no significant effect in the long run. A decrease in export reduces CO2 emissions in the long term, and an increase in export does not affect CO2. In the long run, increases in imports raise CO2 emissions. On the other hand, a decrease in export has no effect in the long run. Export and import were affected positively by urbanization and financial development. The study found that an increase in real GDP per capita led to the minimization of CO2 for the most current decades. For two of the four domains, changes in the overall emissions of CO2 and the country's export and import numbers are reflected in different ways in the sectorial carbon dioxide emission share. In these cases, export leads to lower carbon dioxide shares while imports lead to higher co2 share. Equally, [12] examine the link between FDI, renewable energy, non-renewable energy, GDP, and co2 in 26 European countries. The study employed unbalanced panel data in its analysis. Granger causality indicated that there is significant long-run causality running from FDI to co2 emissions. Since FDI-led growth does not appear to apply to both the E.U. countries and the five new member states, FDI-led growth does not appear to be a viable option. On the other hand, the short-term effect of FDI inflows on co2 emissions in the 1st-4the enlargement nations is negligible, but in the long-term, this effect is lost.
Again, Lee (2005) studied the relationship between FDI and pollution in Malaysia. Depending on the level of development of the host country, findings revealed different causation correlations between the two factors. Carbon dioxide emissions Granger cause FDI inflows.
Stock Market and Environmental Quality
[13] Study on stock market development and low-carbon economy in E.U. countries from 1980- to 2016 and found that the stock market fosters a low carbon economy. [14] Study concentrated on finding the asymmetric link between stock market development, energy efficiency, and environmental quality via a nonlinear analysis. The finding from the study indicates that positive and negative shocks on stock market indicators minimize environmental quality by deepening environmental pollution. [15] Concentrated on how environmental degradation reacts to stock market development in developing countries spanning from 1990-to 2014 in a panel of sixty developing countries. From disclosure stock market decreases environmental degradation in the short and long run. [16] Study tackled stock market and financial institution development on co2 emissions with the merit of clean energy usage and international investment in G20 economies from 1981-2017 via the CCEMG model. Findings indicate that the stock market improves the quality of the environment in advanced countries, whiles the stock market decreases, environmental quality is minimized in developing economies. [2] Examined the impact of the stock market, clean energy usage, and urbanization on co2 emissions in BRICS economies from 1993-to 2018. The study revealed that stock market capitalization impacts co2 emissions in China, India, Russia, and South Africa. In the same study stock market positively related to environmental pollution in Brazil. [17] Examined stock market development and carbon intensity from south Asian countries spanning from 1990-to 2016 via the CS-ARDL approach. Findings from the study indicate that stock market development invigorates carbon intensity.
Methodology
Data description
To examine the impact of clean energy, international investment, and the stock market in mitigating CO2 emissions in Cyprus. Our study tried to briefly describe variables as indicated in (Table 1). A detailed description of the variable is presented in (Table 6 in the Appendix) section.
|
Variable(s) |
Acronym |
Proxy |
Source |
|
Clean energy |
C.E. |
Clean energy consumption (% of total final energy consumption)
|
WDI |
|
Stock market capitalization |
SMC |
The market capitalization of listed domestic companies (current US$) |
WDI |
|
International investment |
II |
Foreign direct investment, net (BoP, current US$)
|
WDI |
|
Co2 emissions |
CO2 |
CO2 emissions (metric tons per capita)
|
WDI |
Table 1: Variable Acronym, proxy, and sources.
Model specification
To analyze the relationship among CO2 emissions, stock market development, international investment, and clean energy consumption in Cyprus from 1990 to 2018, we used the ARDL model, [16] utilized in a related study. The generalized ARDL model is specified as: 
Where Y’t is a vector and the variable in (X’t) are allowed to be purely I(0) or I(1) or co-integrated:β and δ are coefficients: Y is the constant: I =1,….,k;p,q are optimal lag orders; it is a vector of the error terms- unobservable zero-mean white noise vector process(serially uncorrelated or independent).
To perform the bounds test for cointegration, the conditional ARDL with four variables are specified as:
 Error correction model
The Error Correction Model (ECM) representation is specified as:
 α1i , α12 , α13 are the short-run dynamic coefficients of the models’ adjustment long-run equilibrium
Results and Discussion
Descriptive statistics
This part displays the descriptive statistics of CO2, REC, GDP, and FD1. Therefore, it is essential to run descriptive statistics to know what our data convey. Again, since our study is quantitative research, we must run descriptive statistics as indicated in (Table 2). We fail to reject the null hypothesis of a normal distribution with the probability statics values. We can say that REC, SMC, GDP, and CO2 have a normal distribution contrary, FDI has no normal distribution because it has a significant statistical value. Therefore we reject a normal distribution for international investment because the distribution is clearly not normal.
|
|
REC |
SMC |
GDP |
FDI |
CO2 |
|
Mean |
0.528676 |
4.333754 |
0.442941 |
2.3324941 |
0.836313 |
|
Median |
0.5286760 |
0.0000000 |
0.570888 |
0.000000 |
0.846861 |
|
Maximum |
1.084347 |
10.236882 |
0.973128 |
10.18425 |
0.893226 |
|
Minimum |
-0.475137 |
0.000000 |
-0.396382 |
0.000000 |
0.746446 |
|
Std.Dev |
0.465187 |
4.897775 |
0.381399 |
4.214042 |
0.043400 |
|
Skewness |
-1.026349 |
0.214001 |
-0.589624 |
7.476732 |
-0.506508 |
|
Kurtosis |
3.122611 |
4.797202 |
2.785450 |
0.023793 |
2.026176 |
|
Jacque-Bera |
5.109564 |
4.797202 |
2.785450 |
7.476732 |
2.385898 |
|
Probability |
0.077709 |
0.0908450 |
0.248397 |
0.023793 |
0.303325 |
|
Sum |
15.33160 |
125.6789 |
12.84529 |
67.64234 |
24.25309 |
|
Sum Sq, Dev. |
6.059159 |
671.6697 |
4.073028 |
497.2283 |
0.052741 |
Table 2: Descriptive statistics.
Moreover, it is imperative to check for data stationarity using panel data series. Therefore, our study utilizes the ADF standard unit root test for stationarity checks. All the variables are integrated at I(1) and I(0) per (Tables 3 & 4). presents the short-run ARDL estimations. CO2 itself, the lagged period, positively influences the current period. At lag 1, foreign direct investment negatively influences CO2 emissions but is not significant in the short term. The rising foreign direct investment can decrease CO2 emissions. This section of our finding is consistent with [12]. In the case of GPD, GDP has a positive impact on CO2, but the impact is not significant. This implies that as the economy experiences growth, CO2 emissions increase. This is consistent with [7].
|
Method |
Level |
First-difference |
||
|
|
Constant |
Constant &Trend |
Constant |
Constant &Trend |
|
LnCO2 |
-1.3064 |
-2.2468 |
-4.1532*** |
-4.2944** |
|
LnREC |
-2.3236 |
-3.2996 |
-3.7388** |
-3.8332* |
|
LnSMC |
-0.9437 |
-2.1011 |
-5.1524*** |
-5.0492*** |
|
LnFDI |
-4.5156** |
-4.9507*** |
-2.9063 |
-2.38016 |
|
LnGDP |
-4.4721*** |
-2.6851 |
-4.1532** |
-4.2944** |
Table 3: Unit root test (ADF).
|
Variable |
Coefficient |
Std. Error |
t. Statistic |
Prob* |
|
LnCO2(-1) |
0.833 |
0.0743 |
11.200 |
0.000 |
|
LnFDI |
-0.000 |
0.000 |
-0.511 |
0.614 |
|
LnFDI(-1) |
-0.001 |
0.000 |
-1.434 |
0.166 |
|
LnGDP |
0.018 |
0.009 |
1.993 |
0.060 |
|
LnREC |
-0.035 |
0.020 |
-1.674 |
0.109 |
|
LnREC(-1) |
0.024 |
0.000 |
1.230 |
0.232 |
|
LnSMC |
0.000 |
0.000 |
0.345 |
0.733 |
|
C |
0.142 |
0.064 |
2.217 |
0.038 |
|
Adjusted R-squared |
0.890 |
|
|
|
|
F-statistic |
32.441 |
|
|
|
|
Prob(F-statistic) |
0.000 |
|
|
|
Table 4: ARDL short-run Estimations.
Renewable energy consumption negatively influences CO2 emissions but is not significant, which means that renewable energy consumption decreases CO2 emissions in the short run. These findings of our studies do not support the result of [6]. The stock market positively relates to co2 emission in the short run but is not significant. This means that the stock market can increase CO2 emissions in the short run. This part of the findings is in line with [2] and [17]. The adjusted r-square is 89 percent value 32.44(p=0.00) is significant, and the Durbin Watson value is 2.4263, which proves that it is free from serial correlation.
(Table 4) presents the ARDL error correction model. Based on the error correction model, foreign direct investment is negatively related to CO2 emissions but not significant. This means that foreign direct investment can decrease CO2 emissions in the short run. Renewable energy hurts CO2 emissions with a significant probability value. So in the short run, renewable energy can minimize CO2 emissions in Cyprus. CointEq(-1)* value of -0.166 means a high speed of adjustment from the short run to the long run. If there is any disequilibrium, it takes an average speed of 16.6% to adjust back from the short run to the long run. (Table 5) presents the long-run ARDL form.
|
Variable |
coefficient |
Std Error |
t-statistic |
Prob. |
|
C |
0.142 |
0.064 |
2.217 |
0.038 |
|
LnCO2(-1)* |
-0.166 |
0.074 |
-2.241 |
0.036 |
|
LnFDI(-1) |
-0.001 |
0.001 |
-1.817 |
0.084 |
|
LnGDP** |
0.018 |
0.009 |
1.993 |
0.060 |
|
LnREC(-1) |
-0.010 |
0.008 |
-1.226 |
0.234 |
|
LnSMC** |
0.000 |
0.000 |
0.345 |
0.733 |
Table 5: ARDL long run Estimation.
The lag period of CO2 has a negative influence on the current period. Meaning CO2 negatively impacts itself. Foreign direct investment is negatively related to CO2 in the long run but not significant. This suggests that foreign direct investment can decrease CO2 emissions in the long term. This finding contrasts with Lee (2005) and [11]. GDP is positively related to CO2 emissions in the long run but not significant. This implies that economic growth can increase CO2 in the long run in Cyprus. Renewable energy negatively impacted CO2 emissions but was not significant. This suggests that renewable energy can reduce CO2 emissions in the long run. This part of our result is consistent with [4] and [5]. On the other hand, the stock market positively influences CO2 emissions but is not significant. This in in contrast with [13] and [14]. (Table 6) presents the information on the Bounds test. The f-statistic value indicates a long-run equilibrium relationship between the dependent and the independent variables.
|
Test Statistic |
Value |
Signif |
I(0) |
I(1) |
|
F-statistics |
4.264 |
10% |
2.2 |
3.09 |
|
K |
4 |
5% |
2.56 |
3.49 |
|
|
|
2.5% |
2.88 |
3.87 |
|
|
|
1% |
3.29 |
4.37 |
Table 6: F-Bounds Test.
This part of our result is consistent with [3]. The f-statistics value is higher than five, ten, and two percent lower bound and upper bound [18-54]. This means that our model passed the cointegration test.
Conclusion and Policy Implication
The study sought to determine whether the collaboration between clean energy, Stock market development, and international investment, abate CO2 emissions in Cyprus. Our study employed descriptive statistics and correlation to know the normality and multicollinearity of the variables. ADF validated the stationarity of the variables. Per the short-run ARDL model, rising foreign direct investment can decrease CO2 emissions as the economy experiences growth, CO2 emissions increase in the short term. Renewable energy consumption decreases CO2 emissions in the short run. The stock market positively relates to co2 emission in the short run. Per the Durbin Watson value, the model is free from serial correlation.
Nevertheless, in the long run, ARDL revealed that foreign direct investment is negatively related to CO2 in the long run. Renewable energy negatively impacted CO2 emissions in the long run. The stock market positively influences CO2 emissions. The Error Correction Model revealed sixteen point six percent the high speed of adjustment from the short run to the long run. The bound test validated a long-run equilibrium relationship between the dependent and the independent variables. The finding of the study triggered the following policy insight. Effective policies on international investment stock market development should be implemented to accelerate clean energy consumption while minimizing environmental degradation. The findings suggest that stock market development positively relates to environmental quality, implying that Cyprus should invest more in stock market development.
Further, a shift in views towards stock market development is required, and officials in Cyprus should implement regulations that promote the sector's growth. The study also fills the lacuna in environmental repercussions caused by the energy commission's minimal coverage of environmental mitigation and restoration systems. As a result, there is a pressing need to focus on energy efficiency, improving the technical know-how of energy production and transmission, and substituting clean fuels for conventional fuels. This would aid in reversing the detrimental effect of energy production and its utilization on the environment. This research looked into the effect of clean energy, international investment, and stock market development on environmental quality in Cyprus alone; therefore, future research should look into Cyprus's institutional flaws, notably those that impede international investment and environmental law.
Declaration
Ethical Approval
Not applicable
Consent to Participate
Not applicable
Consent to Publish
Not applicable
Author’s Contribution
BAA wrote the introduction section, the methodology, analysed and interpreted the data regarding the subject under study. All author’(s) read and approved the final manuscript
Funding
This current study did not receive any funding from anybody or organization.
Competing interests
The authors declare that they have no competing interest
Availability of Data and materials
The data used and/ or analyzed during the current study are available from the corresponding author on reasonable request
References
- IRENA (2021) International clean energy agency. Total capacity.
- Younis I, Naz A, Shah SAA, Nadeem M, Longsheng C (2021) Impact of the stock market, renewable energy consumption and urbanization on environmental degradation: New evidence from BRICS countries. Environmental Science and Pollution Research 1-17.
- Asiedu BA, Hassan AA, Bein MA (2021) Renewable energy, non-renewable energy, and economic growth: Evidence from 26 European countries. Environmental Science and Pollution Research28: 11119-11128.
- Shafiei S, Salim RA (2014) Non-renewable and renewable energy consumption and CO2 emissions in OECD countries: A comparative analysis. Energy Policy66: 547-556.
- Behera SR, Dash DP (2017) The effect of urbanization, energy consumption, and foreign direct investment on the SSEA (South and Southeast Asian) carbon dioxide emission. Renewable and Sustainable Energy Reviews70: 96-106.
- Hussain I, Rehman A (2021) Exploring the dynamic interaction of CO2 emission on population growth, foreign investment, and renewable energy by employing the ARDL bounds testing approach. Environmental Science and Pollution Research 1-11.
- Dogan E, Ozturk I (2017) The influence of renewable and non-renewable energy consumption and real income on CO2 emissions in the USA: Evidence from structural break tests. Environmental Science and Pollution Research24: 10846-10854.
- Shabir M, Ali M, Hashmi SH, Bakhsh S (2021) Heterogeneous effects of economic policy uncertainty and foreign direct investment on environmental quality: Cross-country evidence. Environmental Science and Pollution Research 1-16.
- Zhuo J, Qamruzzaman M (2021) Do financial development, FDI, and globalization intensify environmental degradation through the channel of energy consumption: Evidence from belt and road countries. Environmental Science and Pollution Research 1-20.
- Haug AA, Ucal M (2019) The role of trade and FDI for CO2 emissions in Turkey: Nonlinear relationships. Energy Economics81: 297-307.
- Mert M, Bölük G, Ça?lar AE (2019) Interrelationships among foreign direct investments, renewable energy, and CO2 emissions for different European country groups: A panel ARDL approaches. Environmental Science and Pollution Research26: 21495-21510.
- Zeqiraj V, Sohag K, Soytas U (2020) Stock market development and low-carbon economy: The role of innovation and renewable energy. Energy Economics91: 104908.
- Goutte S, Guesmi K, Mhadhbi M, Gallali M (2021) On the asymmetric relationship between stock market development, energy efficiency and environmental quality: A nonlinear analysis. International Review of Financial Analysis 77: 101840.
- Topcu M, Tugcu CT, Ocal O (2020) How Does Environmental Degradation React to Stock Market Development in Developing Countries?. In Econometrics of Green Energy Handbook291-301.
- Habiba U, Xinbang C, Ahmad RI (2021) The influence of the stock market and financial institution development on carbon emissions is essential for renewable energy consumption and foreign direct investment in G20 countries. Environmental Science and Pollution Research 28: 67677-67688.
- Sharma R, Shahbaz M, Sinha A, Vo XV (2021) Examining the temporal impact of stock market development on carbon intensity: Evidence from South Asian countries. Journal of Environmental Management297: 113248.
- Habiba U, Xinbang C (2022) The impact of financial development on CO2 emissions: New evidence from developed and emerging countries. Environmental Science and Pollution Research 1-14.
- Tiwari AK (2011) Evidence from India is a structural VAR analysis of renewable energy consumption, real GDP, and CO2 emissions. Economics Bulletin31: 1793-1806.
- Acharyya J (2009) FDI, growth and the environment: Evidence from India on CO2 emission during the last two decades. Journal of economic development34: 43.
- Acheampong IK, Wiafe EA (2013) Foreign direct investment and stock market development: Evidence from Ghana. International Journal of finance and policy Analysis5: 3-15.
- Adam AM, Tweneboah G (2009) Foreign direct investment and stock market development: Ghana's evidence. International research journal of finance and economics, 26: 178-185.
- Agbloyor EK, Abor J, Adjasi CKD, Yawson A (2013) Exploring the causality links between financial markets and foreign direct investment in Africa. Research in International Business and Finance28: 118-134.
- Ahmed F, Ali I, Kousar S, Ahmed S (2022) The environmental impact of industrialization and foreign direct investment: Empirical evidence from Asia-Pacific region. Environmental Science and Pollution Research 1-15.
- Azam M, Ibrahim Y, Bakhtyar B (2014) Foreign direct investment and economic growth in Asia. ????????? ???????? ????????? 58-67.
- Bouziane SE, Dugdale J, Khadir MT (2021) Modeling renewable energy production and CO2 emissions in the region of Adrar in Algeria using LSTM neural networks.
- Bukhari N, Shahzadi K, Ahmad MS (2014) The consequence of FDI on CO2 emissions in the case of Pakistan. Middle-East Journal of Scientific Research20: 1183-1189.
- Gökmeno?lu K, Taspinar N (2016) The relationship between CO2 emissions, energy consumption, economic growth, and FDI: The case of Turkey. The Journal of International Trade & Economic Development25: 706-723.
- Granger CW (1980) Testing for causality: A personal viewpoint. Journal of Economic Dynamics and control2: 329-352.
- Hajilee M, Nasser OMA (2015) The relationship between financial market development and foreign direct investment in Latin American countries. The Journal of Developing Areas 227-245.
- Im KS, Pesaran MH, Shin Y (2003) Testing for unit roots in heterogeneous panels. Journal of econometrics115: 53-74.
- IRENA (2022) International clean energy agency. Total capacity.
- Jafri MAH, Abbas S, Abbas SMY, Ullah S (2021) Caring for the environment: Measuring the dynamic impact of remittances and FDI on CO2 emissions in China. Environmental Science and Pollution Research 1-9.
- Jiang Y (2015) Foreign direct investment, pollution, and the environmental quality: A model with empirical evidence from the Chinese regions. The International Trade Journal29: 212-227.
- Kaur M, Yadav SS, Gautam V (2013) Financial system development and foreign direct investment: A panel data study for BRIC countries. Global Business Review14: 729-742.
- Lee CG (2009) Foreign direct investment, pollution, and economic growth: Evidence from Malaysia. Applied Economics 41: 1709-1716.
- Levin A, Lin CF, Chu CS J (2002) Unit root tests in panel data: Asymptotic and finite-sample properties. Journal of econometrics 108: 1-24.
- Lin H, Wang X, Bao G, Xiao H (2022) Heterogeneous spatial effects of FDI on CO2 emissions in China. Earth's Future e2021EF002331.
- Lipsey RE (2001) Foreign direct investment and the operations of multinational firms: Concepts, history, and data.
- Long J, Shelhamer E, Darrell T (2015) Fully convolutional networks for semantic segmentation. In Proceedings of the IEEE conference on computer vision and pattern recognition3431-3440.
- Malik IA, Amjad S (2013) Foreign direct investment and stock market development in Pakistan. Journal of International Trade Law and Policy.
- Mroua M, Bouattour H, Naifar N (2021) Dynamic links between clean energy, commodities, and financial stock markets: Implications for portfolio diversification. International Journal of Financial Engineering 2150023.
- Nonnenberg MJB, Mendonca MJC (2004) The determinants of direct foreign investment in developing countries. Available at SSRN 525462.
- Pao HT, Fu HC (2013) Clean energy, non-clean energy, and economic growth in Brazil. Clean and Sustainable Energy Reviews25: 381-392.
- Paramati SR, Mo D, Gupta R (2017) The effects of stock market growth and clean energy use on CO2 emissions: Evidence from G20 countries. Energy Economics66: 360-371.
- Paramati SR, Ummalla M, Apergis N (2016) The effect of foreign direct investment and stock market growth on clean energy use across a panel of emerging market economies. Energy Economics56: 29-41.
- Prabhakar AC, Azam M, Bakhtyar B, Ibrahim Y (2015) Foreign direct investment, trade and economic growth: A new paradigm of the BRICS. Modern Applied Science 9: 32-42.
- Pradhan RP, Arvin MB, Hall JH (2019) The nexus between economic growth, stock market depth, trade openness, and foreign direct investment: The case of ASEAN countries. The Singapore Economic Review64: 461-493.
- Razmi S F, Bajgiran BR, Behname M, Salari TE, Razmi SMJ (2020) The relationship of clean energy consumption to stock market development and economic growth in Iran. Clean Energy 145: 2019-2024.
- Rezagholizadeh M, Aghaei M, Dehghan O (2020) Foreign direct investment, stock market development, and clean energy consumption: A case study of Iran. Journal of Clean Energy and Environment7: 8-18.
- Saadaoui H, Chtourou N (2022) Do Institutional Quality, Financial Development, and Economic Growth Improve Renewable Energy Transition? Some Evidence from Tunisia. Journal of the Knowledge Economy 1-32.
- Shahbaz M, Mallick H, Mahalik MK, Sadorsky P (2016) The role of globalization on the recent evolution of energy demand in India: Implications for sustainable development. Energy Economics 55: 52-68.
- Shi J, Bilson C, Powell JG, Wigg J (2010) Foreign direct investment and international stock market integration. Australian Journal of Management 35: 265-290.
- Tsagkanos A, Siriopoulos C, Vartholomatou K (2019) Foreign direct investment and stock market development: Evidence from a “new” emerging market. Journal of Economic Studies 46.
- Ucal M, Haug AA, Bilgin M H (2016) Income inequality and FDI: Evidence with Turkish data. Applied Economics 48: 1030-1045.
Appendix
|
Variable(s) |
Acronym |
Proxy |
Definition |
source |
|
Clean energy |
C.E. |
Renewable energy consumption (% of total final energy consumption)
|
Clean energy consumption is the share of renewable energy in total final energy consumption. |
WDI |
|
Stock market capitalization |
SMC |
The market capitalization of listed domestic companies (current US$) |
Stock market capitalization: Market capitalization (also known as market value) is the share price times the number of shares outstanding (including their several classes) for listed domestic companies. Investment funds, unit trusts, and companies whose only business goal is to hold shares of other listed companies are excluded. Data are end-of-year values converted to U.S. dollars using corresponding year-end foreign exchange rates.
|
WDI |
|
International investment |
II |
Foreign direct investment, net (BoP, current US$)
|
International investment: international investments are the net inflows of investment to acquire a lasting management interest (10 percent or more of voting stock) in an enterprise operating in an economy other than the investor. As shown in the balance of payments, it is the sum of equity capital, reinvestment of earnings, other long-term capital, and short-term capital. This series shows the total net FDI. In BPM6, financial account balances are calculated as the change in assets minus the liabilities. Net FDI outflows are assets, and net FDI inflows are liabilities. Data are in current U.S. dollars.
|
WDI |
|
CO2 emissions |
CO2 |
CO2 emissions (metric tons per capita)
|
Carbon dioxide emissions stem from the burning of fossil fuels and the manufacture of cement. They include carbon dioxide produced during solid, liquid, and gas fuels and gas flaring.
|
WDI |
Table 6: Detail description of variables.
Citation: Asiedu BA (2022) Does The Collaboration Between Clean Energy, Stock Market Development, And International Investment Abate CO2 Emission? Insight from Cyprus. J Environ Sci Curr Res 9: 036.
Copyright: © 2022 Benjamin Ampomah Asiedu, et al. This is an open-access article distributed under the terms of the Creative Commons Attribution License, which permits unrestricted use, distribution, and reproduction in any medium, provided the original author and source are credited.