Effect of Supplementary Feeding on Culture Performance of Etroplus suratensis (Bloch. 1790) in a Biofilm-Based Rearing System
*Corresponding Author(s):
Chavan BRDepartment Of Aquaculture, College Of Fisheries, Shirgaon, Ratnagiri, Maharashtra 415629, India
Email:brc15672@gmail.com
Abstract
The efforts were made to evaluate the effect of supplementary feeding in pearlspot, Etroplus suratensis biofilm-based rearing system using four treatments consisting of T1 (Supplementary feed+Added substrate); T2 (Reduced supplementary feed+Added substrate); T3 (No Supplementary feed+Added substrate) and C-Control (Supplementary feed+No added substrate) at the stocking density of 100 advanced fry m-3. Sugarcane bagasse was used as a substrate for biofilm formation following standard fertilization protocols. The bacterial load, chlorophyll-a and pheophytin content in the water were found to affect dissolved oxygen levels in the biofilm-based rearing system. The total ammonia-nitrogen level, nitrite-nitrogen and nitrate-nitrogen at end of the present investigation were found significantly higher in T1 may be owing to high feeding intensity than in T3 and T2. The bacterial load in terms of total plate count on substrates was also found to be positively affected by different feeding levels in substrate-based treatments. The growth parameters showed a significant positive relationship with increased feeding level representing a strong value of the coefficient of determination (R2) in the substrate-based treatments. The fish biomass yield was found 173.95 % higher in T1, 95.57 % higher in T2 and 128.05 % higher in control than in T3. BCR was the highest rank in T1 followed by T3, then in T3 and lastly in control. Based on the better growth, water quality and economic parameters of the different treatments, the current investigation determined that a biofilm rearing system with full supplementary feeding was financially feasible to produce the required qualities of E. suratensis fingerlings.
Keywords
Biofilm; Economics; Growth; Supplementary feed; Water quality
Introduction
The main problem in the feed-driven aquaculture culture system is the increased operative cost of inert feed and its environmental impacts [1]. The quality and quantity of rations used in aquaculture can add excess nutrients to water resources responsible for environmental pollution. According to [2], only 15–30% of the nutrient input is converted into harvestable products in most feed-driven pond production systems, and the remaining is lost to the sediments, effluents, and the atmosphere. In high-density culture systems the accumulation of harmful nitrogenous compounds, especially ammonia, due to feed addition and excretion of organisms reared at high density affects cultured animals' growth and survival rates [3,4]. In such cases, water exchange is compulsorily required to keep dissolved nutrient levels at an acceptable limit. To tackle these issues brackish water aquaculture needs a sustainable diversified aquaculture system.
Nowadays, aquaculture systems are advanced by introducing microbes in the form of probiotics, biofilm/periphyton, and biofloc [5]. Among microbial systems, the biofilm-based system was found to be cost-effective by reducing the considerable quantity of expensive supplementary feed compared to a conventional fed system [6-9]. A microbial biofilm is composed of the colonization of diverse groups of micro and planktonic organisms such as bacteria, protozoa, fungi, and algae [10]. Biofilm-based aquaculture system is considered a better choice as this system is found to improve water quality parameters and alleviate harmful effects of the overloaded population [11-14]; acts as a natural planktonic food source for reared organisms [15] and augment immunity of aquatic animal against pathogens [16,17]. For sustainable coastal aquaculture, the selection of eligible candidate species should be supplemented by cost-effective and environmentally friendly culture technology. The pearlspot, Etroplus suratensis, is seen to be one of the best candidate species for diversified coastal aquaculture in South Asia [18]. In comparison to other aquatic animal food products, E. suratensis is a hardy species with good flavour, taste, nutritional, economical, and ornamental value. According to [19,20], E. suratensis feeds on degraded organic debris (38 %), filamentous algae (29 %), and miscellaneous materials (8 %). In general E. suratensis is a bottom-feeding scavenger with a preference for herbivory. As a result, microbial biofilm can be used to boost E. suratensis production by improving heterotrophic microbial production through biofilm proliferation on inexpensive, commonly available submerged substrates.
[21] investigated pearlspot, E. suratensis, growth performance, carcass composition and digestive enzyme activity in inland saline groundwater ponds that provided substrate and / or supplementary diet at grow-out stocking density. However, there is a paucity of comparative evaluations on pearlspot cultured performance from fry to fingerling stage grown in fed and non-fed biofilm-based tank systems to determine the actual impact of additional biofilm technology benefits when supplementary feed is offered. As a result, the objective of this study set to determine the impact of additional feeding at various levels on growth, water quality and the economic performance of E. suratensis biofilm-based rearing system.
Material And Methods
- Experimental design
The current study was conducted in twelve uniformly sized circular Fiber-Reinforced Plastic (FRP) tanks of 500 L. All of the tanks were washed with clean water and disinfected with KMnO4. The following day, sun-dried soil was filled to a thickness of 9 to 10 cm, and agricultural lime was applied at a rate of 500 kg ha-1 to all biofilm production tanks [22]. All of the tanks having a top surface area of 0.865 m2 were filled with 300 L of brackish water and were constantly aerated. To prevent undesirable materials from entering the tanks, a fine-mesh filter bag (60 um) was utilised for water filling. The following day, the tanks were fertilised with 3000 kg ha-1 of cow dung and 150 kg ha-1 of urea, respectively [23]. Because sugarcane bagasse was found to be more suited to the pearlspot biofilm-based culture system, it was chosen as a substrate [24]. Bagasse was procured from local sugarcane juice vending shops and soaked in water for two days to remove any remaining sugar. It was then dried out in the sunlight. Nylon threads were used to make the small cylindrical bundles, which were 30 ± 5 cm long. Six bundles with a surface area of approximately 4000 cm2 (800 g) were suspended vertically at a regular distance in each biofilm tank using ropes connected to the walls.
E.suratensis fry were procured from a private hatchery located at Kakadwip, Kolkata, and transported in polythene bags via airways and road transportation. After transportation, fishes were acclimatized to 5 PSU salinity for 15 days. The experimental design consisted of four treatments in triplicates T1 (100 % supplementary feed + Added substrate); T2 (60 % supplementary feed + Added substrate); T3 (No supplementary feed + Added substrate); and C-Control (100 % supplementary feed + No added substrate) at a stocking density of uniform sized fish (4.99 to 5.02 mm / 2.43 to 2.50 g) at the rate of 100 numbers m-3 [25].
The commercial sinking pelleted feed (Manamei, Avanti Feeds Ltd), pellet size, 0.8–1.2 mm containing 35% protein; 5% fat; 4% fibre and 11% moisture was procured from a local feed supplier and used for the experiment. For monitoring feed consumption, the tray was created using stainless steel sieves (31 meshes cm-1) attached to a nylon rope. The sinking pellet diet was initially fed at 12% biomass day-1 in T1 and control, then gradually reduced to 4% biomass day-1 at the end of the trial based on observations of feed consumption in check trays every 10 days. T2 fish were fed 60% of the feeding rate given to T1 and control according to fish growth and biomass. In T3, there was no supplementary feed given (Table 1). Fish biomass was calculated by considering average fish weight of 50% of stocked polulation and observed mortality of fish every 10 days interval. The daily ration was divided into two equal meals provided at 10:00 and 17:00 hours. No water exchange was made except weekly maintaining volume by filling with freshwater to adjust evaporation losses.
|
Culture period (Days) |
Feeding rate (% biomass) |
|||
|
C |
T1 |
T2 |
T3 |
|
|
1-10 |
12.0 |
12.0 |
7.2 |
0 |
|
11-20 |
9.0 |
9.0 |
5.4 |
0 |
|
21-30 |
7.0 |
7.0 |
4.2 |
0 |
|
31-40 |
5.0 |
5.0 |
3.0 |
0 |
|
41-50 |
4.5 |
4.5 |
2.7 |
0 |
|
51-60 |
4.0 |
4.0 |
2.4 |
0 |
Table 1: Supplemntary feeding rate offered to the fishes in different treatments based on check trays observation.
C = No Biofilm + feed; T1= Biofilm + Feed; T2= Biofilm + Reduced feed and T3 = Biofilm + No feed
- Water quality parameters
Water temperature was measured with a mercury-filled Celsius thermometer, pH was measured with a digital pH meter, and salinity was determined with a refractometer (ATAGO, Japan). Dissolved oxygen, total hardness, total alkalinity, ammonia-nitrogen, nitrite-nitrogen, and nitrate-nitrogen were measured using standard protocols given by [26]. In each experimental tank, all water quality parameters were measured every fifteen days during the early hours.
- Chlorophyll-a, Pheophytin and total plate count
Chlorophyll-a and pheophytin-a concentrations from tank water were determined fortnightly. A known amount of water samples were filtered through micro-fiber glass filter paper (Whatman GF/C) using a vacuum pressure air pump. The filter paper was kept in a test tube containing 10 ml of 90% acetone, ground with a glass rod and preserved in a refrigerator for 24 hours. Later, chlorophyll-a was determined using a spectrophotometer at 664, 665 and 750 nm wavelength following [26].
The substrate samples were immediately transferred to labeled tubes containing 10 ml of 90% acetone, sealed and kept in the refrigerator overnight. The samples were homogenised for 30 seconds with a tissue grinder the following day, then refrigerated for 4 hours before being centrifuged for 10 min at 2000-3000 rev min-1. The supernatant was carefully transferred to cuvettes, and absorbance was measured with a spectrophotometer at the wavelength of 750 and 664 nm. After adding three drops of 0.1 N HCl to the samples, the absorbance was measured at 750 and 665 nm after 90 seconds of acidification. The OD value of 750 nm was subtracted from the readings before (OD 664 nm) and after acidification (OD 665 nm). The amounts of chlorophyll-a and pheophytin-a were calculated from the turbidity concentrations using the formulae given in the [26];
 Where,
V1=volume of extract, L
V2=volume of sample, m3
L=light path length or width of cuvette, cm
664b, 665a =optical densities of 90% acetone extract before and after acidification, respectively
The value 26.7 is the absorbance correction.
A bacteriological study was done to evaluate the variation in total bacterial populations in water and the substrates used in the experiment. The bacterial aggregates of the scraped sample were dispensed in suitable diluents by mechanical shaking. Total bacterial plate counts were estimated by the conventional plate count method [27]. Similarly, water samples were collected aseptically from the tanks under different treatments in uricol bottles and bacterial populations were enumerated by the spread plate method using nutrient agar.
The number of colony-forming units (cfu ml-1) in the sample was calculated by multiplying the appropriate dilution factor using the following formula;

- Growth analysis
Growth sampling of fish was carried out at regular intervals in all the experimental groups. Initial and final samplings were carried out by recording the individual length and weights of all survived fishes. The middle samplings were done by harvesting 50 % of the stocked population.
The Daily Weight Gain (DWG), Percentage Weight Gain (PWG), Specific Growth Rate (SGR), percentage survival (%) and economic Feed Conversion Ratio (eFCR) were determined using the following equations [28].
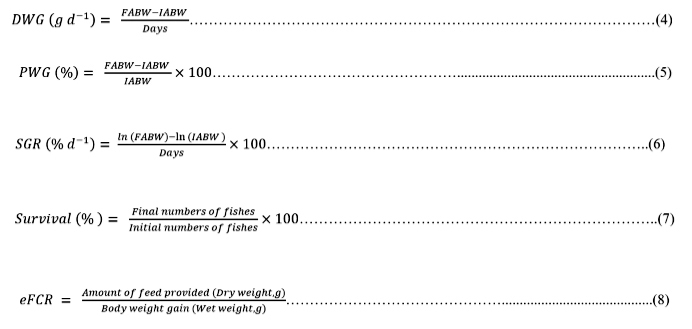 Where, IABW: Initial average body weight (g)
FABW: Final average body weight (g)
ln is the natural log.
- Economic analysis
Capital Cost (I), Fixed Cost (FC), Variable Cost (VC), Total Cost (TC), Gross Return (GR), Net Return (NR=GR - TC), Benefit-Cost Ratio (BCR), Net Present Value (NPV), and Internal Rate of Return (IRR) were the parameters used to calculate the cost structure and economic analysis of the pearlspot biofilm-based rearing system.
The Benefit-Cost Ratio (BCR) for the operation was calculated by using the following formula [29];  The NPV is defined as the present value of the net benefit stream. NPV is calculated using the formula (Diatin et al. 2021);
Where,
Bt=benefit in year t
Ct=cost in year t
n=length of culture in years
i=discount rate
IRR is the interest rate obtained from the present value of total costs equal to the present value of total revenues.
In the present study, the IRR was calculated using the following formula [29]; 
Where,
i′=discount rate resulted from NPV positive
i″=discount rate resulted from NPV negative
NPV′=NPV in interest level i′
NPV″=NPV in interest level i″
The Payback Period (PP) analysis describes the period needed to use cash flow to recover the investment expenditures (original cash investment). Mathematically, the Payback Period (PP) is the period, Np for which: 
Where
C0 is initial cash outlay
Ct is cash inflow in period ‘t’
Discounted Payback Period (DPP) on the other hand is the period, Nd for which:
 Where
Where
i=discount rate. [30]
- Statistical analysis
The data were statistically analyzed using SPSS (Statistical Package for Social Science) version 20.0 (SPSS Inc., Chicago, IL, USA). The treatment means were compared using one-way ANOVA Duncan's Multiple Range Test (DMRT) at a 5% probability level. The relationships between different variables were established using regression models [31]. The performance of regression models was evaluated using the coefficient of determination (R2) and Root Mean Square Error (RMSE). If the value of R2 is close to 1 and the lower the value of RMSE, the better the forecasting model's performance. The following formula was used to calculate the R2 and RMSE;

Where,
RSS=Residuals sum of squares
TSS=Total sum of squares

Where
N Represents the number of samples,
yi Represents the real values,
∧yi Represents the predicted values.
Results
- Water quality parameters
The water quality in all experimental tanks such as temperature (°C), salinity (PSU), pH, total alkalinity (mg L-1), dissolved oxygen (mg L-1) total ammonia nitrogen (mg L-1), nitrite-nitrogen (mg L-1) and nitrate-nitrogen (mg L-1) was fortnightly recorded and their range with average values of all the treatments are presented in (Tables 2-3) and (Figure 1).
|
Water quality parameter |
Treatments |
|||
|
C |
T1 |
T2 |
T3 |
|
|
Temperature (0C) |
23.00 - 26.00 (24.80 ± 1.30) |
23.00 - 26.00 (24.80 ± 1.30) |
23.00 - 26.00 (24.80 ± 1.30) |
23.00 - 26.00 (24.80 ± 1.30) |
|
Salinity (PSU) |
5.00 (5.00 ± 0.00) |
5.00 (5.00 ± 0.00) |
5.00 (5.00 ± 0.00) |
5.00 (5.00 ± 0.00) |
|
pH |
7.08 - 7.78 (7.40 ± 0.29) |
7.09 - 7.58 (7.36 ± 0.24) |
7.05 - 7.57 (7.37 ± 0.21) |
7.17 - 7.62 (7.41 ± 0.21) |
|
Dissolved oxygen (mg L-1) |
4.53 - 5.73 (5.26 ± 0.51) |
4.53 - 5.73 (5.01 ± 0.44) |
4.93 - 5.60 (5.25 ± 0.26) |
5.20 - 5.47 (5.36 ± 0.15) |
|
Total alkalinity (mg L-1) |
77.33 - 111.33 (95.07 ± 15.45) |
80.00 - 112.00 (95.07 ± 13.85) |
80.00 - 113.33 (96.57 ± 15.10) |
77.33 - 116.00 (95.73 ± 18.73) |
|
1 NH4+-N (mg L-1) |
0.12 - 0.70 (0.33 ± 0.26) |
0.10 - 0.47 (0.20 ± 0.15) |
0.08 - 0.57 (0.24 ± 0.20) |
0.06 - 0.67 (0.22 ± 0.26) |
|
2 NO2-N (mg L-1) |
0.43 - 5.26 (2.02 – 1.96) |
0.52 - 2.43 (1.32 ± 0.77) |
0.47 - 2.03 (0.99 ± 0.64) |
0.51 - 2.02 (1.20 – 0.66) |
|
3 NO3-N (mg L-1) |
0.52 - 2.23 (1.19 ± 0.68) |
0.92 - 2.43 (1.31 ± 0.64) |
0.69 - 2.03 (1.29 ± 0.50) |
0.41 - 2.00 (0.82 ± 0.66) |
Table 2: Effect of supplementary feeding in biofilm rearing system of E. suratensis on the water quality parameters during the 60 days of an experiment.
Values are expressed in range (mean ± standard deviation)
There was no significant difference (p≥0.05) observed between treatments for each water quality parameter
1 NH4+-N, Ammonia-Nitrogen; 2 NO2-N, Nitrite-Nitrogen and 3 NO3-N, Nitrate-Nitrogen
C = No Biofilm + feed; T1= Biofilm + Feed; T2= Biofilm + Reduced feed and T3 = Biofilm + No feed
 Figure 1: Effect of supplementary feeding in biofilm rearing system of E. suratensis on variation of water quality parameters during 60 days experimental period
C= No Biofilm + feed; T1= Biofilm + Feed; T2= Biofilm + Reduced feed and T3= Biofilm + No feed.
|
Experimental period |
Parameters |
|
|||
|
C |
T1 |
T2 |
T3 |
||
|
Initial before stocking |
pH |
7.24a ± 0.09 |
7.10a ± 0.05 |
7.24a ± 0.04 |
7.22a ± 0.06 |
|
Salinity (PSU) |
5.00a ± 0.00 |
5.00a ± 0.00 |
5.00a ± 0.00 |
5.00a ± 0.00 |
|
|
Temperature (0C) |
24.00a ± 0.00 |
24.00a ± 0.00 |
24.00a ± 0.00 |
24.00a ± 0.00 |
|
|
Dissolved oxygen (mg L-1) |
5.50a ± 0.08 |
5.73a ± 0.13 |
5.60a ± 0.00 |
5.47a ± 0.13 |
|
|
Total alkalinity (mg L-1) |
84.00a ± 2.00 |
80.00a ± 2.00 |
80.00a ± 4.00 |
77.33a ± 5.33 |
|
|
1NH4+-N (mg L-1) |
0.70a ± 0.06 |
0.47a ± 0.09 |
0.57a ± 0.09 |
0.67a ± 0.03 |
|
|
2NO2-N (mg L-1) |
1.57a ± 0.12 |
1.50a ± 0.17 |
1.50a ± 0.06 |
1.40a ± 0.06 |
|
|
3NO3-N (mg L-1) |
2.23a ± 0.19 |
2.43 a ± 0.09 |
2.03a ± 0.28 |
2.00a ± 0.15 |
|
|
15th day after stocking |
pH |
7.28a ± 0.06 |
7.47ab ± 0.03 |
7.51ab ± 0.09 |
7.58b ± 0.09 |
|
Salinity (PSU) |
5.00a ± 0.00 |
5.00a ± 0.00 |
5.00a ± 0.00 |
5.00a ± 0.00 |
|
|
Temperature (0C) |
25.00 ± 0.00 |
25.00 ± 0.00 |
25.00 ± 0.00 |
25.00 ± 0.00 |
|
|
Dissolved oxygen (mg L-1) |
4.93a ± 0.13 |
4.93a ± 0.13 |
4.93a ± 0.35 |
5.20a ± 0.40 |
|
|
Total alkalinity (mg L-1) |
77.33a ± 2.91 |
86.67a ± 1.33 |
81.33a ± 4.81 |
78.67a ± 4.81 |
|
|
1NH4+-N (mg L-1) |
0.21ab ± 0.01 |
0.15a ± 0.03 |
0.21a ± 0.02 |
0.15a ± 0.02 |
|
|
2NO2-N (mg L-1) |
5.26b ± 2.11 |
1.35a ± 0.08 |
0.85a ± 0.37 |
2.02ab ± 0.11 |
|
|
3NO3-N (mg L-1) |
1.42b ± 0.22 |
0.92ab ± 0.18 |
1.36ab ± 0.25 |
0.66a ± 0.24 |
|
|
30th day after stocking |
pH |
7.08a ± 0.04 |
7.09a ± 0.05 |
7.05a ± 0.04 |
7.17a ± 0.07 |
|
Salinity (PSU) |
5.00a ± 0.00 |
5.00a ± 0.00 |
5.00a ± 0.00 |
5.00a ± 0.00 |
|
|
Temperature (0C) |
26.00 ± 0.00 |
26.00 ± 0.00 |
26.00 ± 0.00 |
26.00 ± 0.00 |
|
|
Dissolved oxygen (mg L-1) |
5.60a ± 0.23 |
4.93a ± 0.13 |
5.33a ± 0.13 |
5.47a ± 0.35 |
|
|
Total alkalinity (mg L-1) |
92.00a ± 2.31 |
89.33a ± 3.53 |
101.33a ± 9.33 |
93.33a ± 2.67 |
|
|
1NH4+-N (mg L-1) |
0.51b ± 0.13 |
0.17a ± 0.04 |
0.21a ± 0.03 |
0.15a ± 0.01 |
|
|
2NO2-N (mg L-1) |
1.63a ± 0.25 |
1.60a ± 0.09 |
0.86a ± 0.28 |
1.52a ± 0.38 |
|
|
3NO3-N (mg L-1) |
1.14b ± 0.12 |
0.92ab ± 0.18 |
1.36b ± 0.25 |
0.41a ± 0.02 |
|
|
45th day after stocking |
pH |
7.78b ± 0.08 |
7.55ab ± 0.15 |
7.49a ± 0.04 |
7.48a ± 0.02 |
|
Salinity (PSU) |
5.00a ± 0.00 |
5.00a ± 0.00 |
5.00a ± 0.00 |
5.00a ± 0.00 |
|
|
Temperature (0C) |
26.00a ± 0.00 |
26.00a ± 0.00 |
26.00a ± 0.00 |
26.00a ± 0.00 |
|
|
Dissolved oxygen (mg L-1) |
5.73b ± 0.13 |
4.93a ± 0.13 |
5.33ab ± 0.13 |
5.47ab ± 0.35 |
|
|
Total alkalinity (mg L-1) |
111.33a ± 1.76 |
107.33a ± 6.36 |
106.67a ± 4.37 |
113.33a ± 9.82 |
|
|
1NH4+-N (mg L-1) |
0.13b ± 0.02 |
0.11ab ± 0.01 |
0.11ab ± 0.01 |
0.06a ±0.02 |
|
|
2NO2-N (mg L-1) |
0.57a ± 0.03 |
0.52a ± 0.18 |
0.47a ± 0.03 |
0.51a ± 0.04 |
|
|
3NO3-N (mg L-1) |
0.65a ± 0.05 |
1.09b ± 0.09 |
0.69a ± 0.09 |
0.51a ± 0.06 |
|
|
60th day after stocking |
pH |
7.60a ± 0.13 |
7.58a ± 0.11 |
7.57a ± 0.07 |
7.62a ± 0.15 |
|
Salinity (PSU) |
5.00a ± 0.00 |
5.00a ± 0.00 |
5.00a ± 0.00 |
5.00a ± 0.00 |
|
|
Temperature (0C) |
23.00a ± 0.00 |
23.00a ± 0.00 |
23.00a ± 0.00 |
23.00a ± 0.00 |
|
|
Dissolved oxygen (mg L-1) |
4.53a ± 0.13 |
4.53a ± 0.13 |
5.07ab ± 0.13 |
5.20b ± 0.23 |
|
|
Total alkalinity (mg L-1) |
110.67a ± 8.97 |
112.00a ± 1.15 |
113.33a ± 1.33 |
116.00a ± 6.11 |
|
|
1NH4+-N (mg L-1) |
0.12b ± 0.01 |
0.10b ± 0.01 |
0.08ab ± 0.01 |
0.06a ± 0.01 |
|
|
2NO2-N (mg L-1) |
0.43a ± 0.06 |
0.68b ± 0.04 |
0.50a ± 0.06 |
0.53ab ± 0.05 |
|
|
3NO3-N (mg L-1) |
0.52a ± 0.07 |
1.18c ± 0.01 |
0.99b ± 0.07 |
0.54a ± 0.05 |
|
Table 3: Effect of supplementary feeding in biofilm rearing system of E. suratensis on variation of water quality paeameters at fortnight intervals during 60 day of an experiment.
Values are expressed in mean ± error
a ,b, c, d mean values in a column with different superscripts differ significantly (p < 0.05)
1 NH4+-N, Ammonia-Nitrogen; 2 NO2-N, Nitrite-Nitrogen and 3 NO3-N, Nitrate-Nitrogen
C = No Biofilm + feed; T1= Biofilm + Feed; T2= Biofilm + Reduced feed and T3 = Biofilm + No feed
The water temperature ranged between 23.0 °C to 26.0 °C with a mean value of 24.80 ± 1.30 °C in all treatment groups during 60 days of the experimental period. The water salinity was maintained and recorded at 5 PSU in all treatment groups throughout the experimental period of 60 days. pH was observed to be significantly higher (P≤0.05) in T3 (7.58 ± 0.09) than in the control (7.28 ± 0.06) during sampling on the 15th day after stocking. In comparison, it was significantly lower (P≤0.05) in T2 (7.49 ± 0.04) and T3 (7.48 ± 0.02) than in control (7.78 ± 0.08) during sampling on the 45th day after stocking.
DO level was reported significantly lower (P≤0.05) in T1 (4.93 ± 0.13 mg L-1) than in control (5.73 ± 0.09 mg L-1) during sampling on the 45th day after stocking (Fig. 1). However, the DO level was observed to be significantly higher (P≤0.05) in T3 (5.20 ± 0.02 mg L-1) than in control (4.53 ± 0.13 mg L-1) and T1 (4.53 ± 0.13 mg L-1) at the end of the experiment. Total ammonia-nitrogen was observed to be significantly lower (P≤0.05) in all treatment groups than in control during sampling on the 30th day after stocking and was significantly lower (P≤0.05) in T3 (0.06 ± 0.02 mg L-1) than in control (0.13 ± 0.02 mg L-1) at 45th day after stocking (Fig. 1). At the end of the experiment, ammonia-nitrogen in T3 (0.06 ± 0.02 mg L-1) was reported significantly lower (P≤0.05) than in T1 (0.10 ± 0.01 mg L-1) and control (0.12 ± 0.01 mg L-1). . Total nitrite-nitrogen was recorded significantly lower (P≤0.05) in T1 (1.35 ± 0.08mg L-1) and T2 (0.85 ± 0.37mg L-1) than in control (5.26 ± 2.11 mg L-1) during sampling of 15th day after stocking (Fig. 1). However, total nitrite-nitrogen was found significantly higher (P≤0.05) in T1 (0.68 ± 0.04 mg L-1) than in T2 (0.50 ± 0.06 mg L-1) and control (0.43 ± 0.06 mg L-1) at the end of the experiment. Total nitrate-nitrogen was reported to be significantly lower (P≤0.05) in T1 (1.35 ± 0.08 mg L-1) and T2 (0.85 ± 0.37 mg L-1) than in control (5.26 ± 2.11 mg L-1) during sampling of 15th day after stocking (Figure 1). However, total nitrate-nitrogen was reported significantly higher (P≤0.05) in control (1.42 ± 0.22 mg L-1) than in T3 (0.66 ± 0.24 mg L-1) and at the end of the experiment.
- Chlorophyll-a, Pheophytin and total plate count
The Chlorophyll-a, Pheophytin and total plate count in the water as well as on substrate were fortnightly recorded and their range with average values and variation during the experimental period among all the treatments are presented in (Table 4-6) and (Figure 2 & 3).
|
Source |
Parameter |
Treatments |
|||
|
|
C |
T1 |
T2 |
T3 |
|
|
|
|
|
|||
|
|
Chlorophyll-a (mg L-1) |
0.12 - 0.19 (0.16a ± 0.02) |
0.13 - 0.24 (0.18a ± 0.05)
|
0.08- 0.16 (0.12a ± 0.03)
|
0.12 - 0.19 (0.15a ± 0.03)
|
|
Water |
Pheophytin (mg L-1) |
0.19 - 0.23 (0.21a ± 0.02) |
0.16 - 0.26 (0.21a ± 0.04)
|
0.16 - 0.24 (0.19a ± 0.03)
|
0.12 - 0.22 (0.17a ± 0.04)
|
|
|
Total plate count (cfu X106 ml-1 ) |
5.53 – 17.43 (11.60a ± 4.98) |
6.30 - 23.87 (16.73a ± 8.20) |
7.40 - 23.27 (14.49a ± 6.71) |
6.63 - 21.43 (13.07a ± 6.15) |
|
|
|
|
|||
|
|
Chlorophyll-a (ug cm-2) |
---- |
1.29 – 9.93 (4.78a ± 3.87) |
1.40 – 8.38 (3.35a ± 2.98) |
0.74 – 1.74 (1.15a ± 0.39) |
|
Substrate |
Pheophytin (ug cm-2) |
---- |
1.55 – 7.98 (3.76a ± 2.60) |
1.29 – 4.80 (3.00a ± 1.64) |
0.65 – 2.03 (1.38a ± 0.52) |
|
|
Total plate count (cfu X108 cm-2) |
---- |
7.08 – 22.92 (16.17b ± 6.59) |
6.67 – 27.08 (16.28b ± 7.32) |
2.30 – 7.92 (5.13a ± 2.57) |
Table 4: Effect of supplementary feeding in biofilm rearing system of E. suratensis on chlorophyll-a content, pheophytin content and total plate count of bacteria present in water and on substrate during the 60 days of an experiment.
Values are expressed in mean ± standard deviation
a ,b, c, d mean values in a column with different superscripts differ significantly (p < 0.05)
C = No Biofilm + feed; T1= Biofilm + Feed; T2= Biofilm + Reduced feed and T3 = Biofilm + No feed
|
Experimental period |
Parameters |
Treatments |
|||
|
C |
T1 |
T2 |
T3 |
||
|
Initial before stocking |
Chlorophyll-a (mg L-1) |
0.14a ± 0.01 |
0.14a ± 0.02 |
0.16a ± 0.02 |
0.12a ± 0.00 |
|
Pheophytin-a (mg L-1) |
0.23a ± 0.02 |
0.22a ± 0.01 |
0.24a ± 0.02 |
0.22a ± 0.02 |
|
|
Total plate count (cfu X106 ml-1) |
9.97a ± 0.16 |
9.77a ± 0.52 |
8.33a ± 1.49 |
8.93a ± 1.07 |
|
|
15th day after stocking |
Chlorophyll-a (mg L-1) |
0.19a ± 0.02 |
0.19a ± 0.03 |
0.19a ± 0.03 |
0.16a ± 0.01 |
|
Pheophytin-a (mg L-1) |
0.23a ± 0.02 |
0.20a ± 0.04 |
0.16a ± 0.03 |
0.18a ± 0.03 |
|
|
Total plate count (cfu X106 ml-1) |
5.53a ± 0.30 |
6.30a ± 0.45 |
7.40a ± 1.37 |
6.63a ± 0.32 |
|
|
30th day after stocking |
Chlorophyll-a (mg L-1) |
0.12a ± 0.01 |
0.13a ± 0.03 |
0.14a ± 0.01 |
0.08a ± 0.01 |
|
Pheophytin-a (mg L-1) |
0.19a ± 0.03 |
0.16a ± 0.03 |
0.17a ± 0.03 |
0.12a ± 0.02 |
|
|
Total plate count (cfu X106 ml-1) |
17.43a ± 0.82 |
23.87a ± 2.02 |
23.27a ± 0.59 |
21.43a ± 4.52 |
|
|
45th day after stocking |
Chlorophyll-a (mg L-1) |
0.16b ± 0.00 |
0.21c ± 0.01 |
0.10a ± 0.01 |
0.12a± 0.00 |
|
Pheophytin-a (mg L-1) |
0.20a ± 0.04 |
0.26a ± 0.05 |
0.21a ± 0.05 |
0.18a ± 0.01 |
|
|
Total plate count (cfu X106 ml-1) |
9.07a ± 2.93 |
19.87b ± 1.69 |
18.27b ± 2.76 |
17.83b ± 2.07 |
|
|
60th day after stocking |
Chlorophyll-a (mg L-1) |
0.16a± 0.02 |
0.24b ± 0.02 |
0.16a± 0.02 |
0.10a± 0.01 |
|
Pheophytin-a (mg L-1) |
0.20a± 0.01 |
0.20a± 0.03 |
0.17a± 0.01 |
0.15a± 0.02 |
|
|
Total plate count (cfu X106 ml-1) |
16.00a± 1.40 |
23.87b± 2.43 |
15.20a± 2.27 |
12.30a± 0.55 |
|
Table 5: Effect of supplementary feeding in biofilm rearing system of E. suratensis on chlorophyll-a content, pheophytin content and total plate count of water at fortnight intervals during 60 days of an experiment.
Values are expressed in mean ± error
a ,b, c, d mean values in a column with different superscripts differ significantly (p < 0.05)
C = No Biofilm + feed; T1= Biofilm + Feed; T2= Biofilm + Reduced feed and T3 = Biofilm + No feed
|
Experimental period |
Parameter |
Treatments |
||
|
T1 |
T2 |
T3 |
||
|
Initial before stocking |
Chlorophyll-a (ug cm-2) |
1.29a ± 0.19 |
1.45a ± 0.24 |
1.34a ± 0.22 |
|
Pheophytin (ug cm-2) |
1.55a ± 0.21 |
1.29a ± 0.14 |
1.69a ± 0.13 |
|
|
Total plate count (cfu X108 cm-2) |
7.08a ± 0.42 |
6.67a ± 0.83 |
6.67a ± 1.50 |
|
|
15th day after stocking |
Chlorophyll-a (ug cm-2) |
9.93b ± 0.52 |
8.38b ± 0.77 |
1.73a ± 0.36 |
|
Pheophytin (ug cm-2) |
4.48a ± 1.39 |
4.80a ± 0.40 |
2.03a ± 0.25 |
|
|
Total plate count (cfu X108 cm-2) |
12.92ab ± 1.10 |
14.58b ± 1.50 |
7.92a ± 1.82 |
|
|
30th day after stocking |
Chlorophyll-a (ug cm-2) |
7.88b ± 2.07 |
3.78ab ± 0.28 |
0.74a ± 0.33 |
|
Pheophytin (ug cm-2) |
7.98c ± 0.87 |
4.72b ± 1.03 |
0.65a ± 0.15 |
|
|
Total plate count (cfu X108 cm-2) |
22.08b ± 5.12 |
27.08b ± 2.92 |
2.50a ± 0.54 |
|
|
45th day after stocking |
Chlorophyll-a (ug cm-2) |
2.12b ± 0.21 |
1.40a ± 0.10 |
0.93a ± 0.09 |
|
Pheophytin (ug cm-2) |
2.24b ± 0.26 |
2.27b ± 0.11 |
1.27a ± 0.31 |
|
|
Total plate count (cfu X108 cm-2) |
15.84a ± 2.20 |
15.42a ± 2.32 |
2.30a ± 0.33 |
|
|
60th day after stocking |
Chlorophyll-a (ug cm-2) |
2.67c ± 0.18 |
1.76b ± 0.10 |
1.01a ± 0.12 |
|
Pheophytin (ug cm-2) |
2.53c ± 0.23 |
1.92b ± 0.15 |
1.28a ± 0.03 |
|
|
Total plate count (cfu X108 cm-2) |
22.92b ± 2.73 |
17.67b ± 2.33 |
6.25a ± 0.72 |
|
Table 6: Effect of supplementary feeding in biofilm rearing system of E. suratensis on chlorophyll-a content, pheophytin content and total plate count on the substrate at fortnight intervals during 60 days of an experiment.
Values are expressed in mean ± error
a ,b, c, d mean values in a column with different superscripts differ significantly (p < 0.05)
T1= Biofilm + Feed; T2= Biofilm + Reduced feed and T3 = Biofilm + No feed

Figure 2: Effect of supplementary feeding in biofilm rearing system of E. suratensis on variations of chlorophyll-a content, pheophytin content and total plate count of bacteria present in water during 60 days experimental period.
C= No Biofilm + feed; T1= Biofilm + Feed; T2= Biofilm + Reduced feed and T3= Biofilm + No feed
 Figure 3: Effect of supplementary feeding in biofilm rearing system of E. suratensis on variations of chlorophyll-a content, pheophytin content and total plate count of bacteria present on the substrate during 60 days experimental period.
T1= Biofilm + Feed; T2= Biofilm + Reduced feed and T3= Biofilm + No feed
Chlorophyll-a content in water was found significantly highest (P≤0.05) in T1 (0.21 ± 0.01 mg L-1) followed by control (0.16 ± 0.00 mg L-1) than in T2 (0.12 ± 0.00 mg L-1) and T3 (0.10 ± 0.01 mg L-1) during sampling of 45th day after stocking. Further, chlorophyll-a was reported significantly higher (P≤0.05) in T1 (0.24 ± 0.02 mg L-1) than in other groups at the end of the experiment. There was no significant difference (P≥0.05) between the treatments observed for pheophytin content in water during all of the sampling days. TPC in water did not differ significantly till sampling on the 30th day after stocking. After that, TPC was found significantly lower in control than in other treatments during sampling on the 45th day after stocking. At the end of 60 days experiment, TPC was found higher in T1 than in other treatments.
On day 15 after stocking, chlorophyll-a content on the substrate was significantly higher (P ≤ 0.05) in T1 and T2 than in T3. Later, chlorophyll-a on the substrate was significantly higher (P ≤ 0.05) in T1 than in T3 but did not differ from the mean value observed in T2 during sampling 30 days after stocking. At the time of the 45th day after stocking, chlorophyll-a content on the substrate was reported significantly higher (P ≤ 0.05) in T1 than in T2 and T3. Finally, at the end of 60 days of the experiment, chlorophyll-a content on the substrate was significantly highest (P ≤ 0.05) in T1 followed by T2, and significantly lowest in T3. The trend in chlorophyll-a content on the substrate showed a steady decline from the 15th day after stocking till the end of the experiment.
Initially first 15th day after stocking, there was no significant difference (P ≥ 0.05) in pheophytin content on the substrate observed in between the treatments. On day 30th after stocking, pheophytin content was recorded as significantly highest (P ≤ 0.05) in T1 followed by T2 and significantly lowest (P ≤ 0.05) in T3. Further, pheophytin content on the substrate was significantly higher (P ≤ 0.05) in T1 and T2 than in T3. Final pheophytin content on the substrate at the end of 60 days of the experiment was significantly highest (P ≤ 0.05) in T1 followed by T2 and significantly lowest (P ≤ 0.05) in T3. The trend in pheophytin content on the substrate showed a steady decline in T2 and T3 from the 15th day after stocking and the 30th day after stocking till the end of the experiment in T1.
There were significantly lower (P ≤ 0.05) overall mean values of TPC on substrates observed in T3 than in T1 and T2. On day 15 after stocking, TPC was significantly higher (P ≤ 0.05) in T2 than in T3. Further on the 30th day, TPC was significantly higher (P ≤ 0.05) in T1 and T2 than in T3. A similar trend was observed at end of 60 days experiment, where TPC was significantly higher (P ≤ 0.05) in T1 and T2 than in T3.
Growth parameters
Growth parameters such as Average Body Weight (ABW), Average Body Length (ABL), Daily Weight Gain (DWG), Specific Growth Rate (SGR), Percentage Weight Gain (PWG), biomass, Feed Conversion Ratio (FCR) and survival (%) measured at the fortnightly during the experimental period and have been represented in (Tables 7-8).
|
Growth Parameter |
Treatments |
|||
|
C |
T1 |
T2 |
T3 |
|
|
Initial Length (cm) |
4.99a ± 0.02 |
5.00a ± 0.01 |
5.02a ± 0.01 |
5.02a ± 0.01 |
|
Initial Weight (g) |
2.48a ± 0.07 |
2.43a ± 0.02 |
2.50a ± 0.02 |
2.48a ± 0.04 |
|
Final Length (cm) |
8.41bc ± 0.34 |
8.94c ± 0.02 |
8.05b ± 0.22 |
6.50a ± 0.02 |
|
Final Weight (g) |
11.97bc ± 1.54 |
14.39c ± 0.21 |
10.15b ± 1.08 |
5.25a ± 0.06 |
|
Final Biomass (g) |
359.31bc ± 46.28 |
431.65c ± 6.21 |
304.55b ± 32.35 |
157.56a ± 1.64 |
|
1DWG (g d-1) |
0.16bc ± 0.03 |
0.20c ± 0.01 |
0.13b ± 0.02 |
0.05a ± 0.00 |
|
2PWG (%) |
385.67bc ± 70.78 |
492.80c ± 11.93 |
307.43b ± 47.12 |
111.72a ± 4.82 |
|
3SGR (% d-1) |
2.46bc ± 0.14 |
2.67c ± 0.01 |
2.31b ± 0.10 |
1.66a ± 0.01 |
|
Survival (%) |
100.00a ± 0.00 |
100.00a ± 0.00 |
100.00a ± 0.00 |
98.89a ± 1.11 |
|
Feed given (g) |
774.40c ± 28.43 |
874.85d ± 10.34 |
453.85b ± 18.19 |
0.00a ± 0.00 |
|
4FCR |
2.22c ± 0.24 |
2.03c ± 0.01 |
1.51b ± 0.11 |
0.00a ± 0.00 |
Table 7: Effect of supplementary feeding in biofilm rearing system on different growth parameters of E. suratensis.
Values are expressed in mean ± error
a ,b, c, d mean values in a row with different superscripts differ significantly (p < 0.05)
1DWG, Daily weight gain; 2PWG, Percentage weight gain; 3SGR, Specific growth rate; 4FCR, Feed conversion ratio
C = No Biofilm + feed; T1= Biofilm + Feed; T2= Biofilm + Reduced feed and T3 = Biofilm + No feed
|
Growth parameter |
Treatment |
Experimental period |
||||
|
Initial |
15th day |
30th day |
45th day |
60th day |
||
|
1ABW (g) |
C |
2.48a ± 0.07 |
4.67ab ± 0.24 |
8.42b ± 0.29 |
9.90b ± 0.67 |
11.97bc ± 1.54 |
|
T1 |
2.43a ± 0.02 |
5.36c ± 0.12 |
9.84c ± 0.15 |
11.38c ± 0.15 |
14.39c ± 0.21 |
|
|
T2 |
2.50a ± 0.02 |
5.10bc ± 0.10 |
8.58b ± 0.33 |
8.90b ± 0.71 |
10.15b ± 1.08 |
|
|
T3 |
2.48a ± 0.04 |
4.46a ± 0.03 |
4.98a ± 0.03 |
5.11a ± 0.04 |
5.25a ± 0.06 |
|
|
2ABL (cm) |
C |
4.99a ± 0.02 |
5.50ab ± 0.07 |
7.13b ± 0.11 |
7.67b ± 0.21 |
8.41bc ± 0.34 |
|
T1 |
5.00a ± 0.01 |
5.61b ± 0.04 |
7.51c ± 0.07 |
8.09c ± 0.05 |
8.94c ± 0.02 |
|
|
T2 |
5.02a ± 0.01 |
5.53ab ± 0.02 |
7.24b ± 0.10 |
7.47b ± 0.37 |
8.05b ± 0.22 |
|
|
T3 |
5.02a ± 0.01 |
5.44a ± 0.03 |
5.90a ± 0.03 |
6.19a ± 0.03 |
6.50a ± 0.02 |
|
|
3DWG (g d-1) |
C |
---- |
0.15ab ± 0.02 |
0.19b ± 0.01 |
0.16b ± 0.02 |
0.16bc ± 0.03 |
|
T1 |
---- |
0.20c ± 0.01 |
0.25c ± 0.00 |
0.20c ± 0.00 |
0.20c ± 0.01 |
|
|
T2 |
---- |
0.18bc ± 0.01 |
0.21b ± 0.01 |
0.14b ± 0.01 |
0.13b ± 0.02 |
|
|
T3 |
---- |
0.13a ± 0.00 |
0.08a ± 0.00 |
0.06a ± 0.00 |
0.05a ± 0.00 |
|
|
4PWG (%) |
C |
---- |
88.46ab ± 10.15 |
240.15b ± 20.26 |
300.51b ± 35.96 |
385.67bc ± 70.78 |
|
T1 |
---- |
120.69c ± 5.79 |
305.29c ± 8.93 |
368.73c ± 9.35 |
492.80c ± 11.93 |
|
|
T2 |
---- |
104.50bc ± 5.59 |
243.82b ± 16.50 |
257.04b ± 17.06 |
307.43b ± 47.12 |
|
|
T3 |
---- |
79.76a ± 2.84 |
100.83a ± 2.22 |
106.12a ± 4.15 |
111.72a ± 4.82 |
|
|
5SGR (% d-1) |
C |
---- |
1.54ab ± 0.05 |
2.13b ± 0.04 |
2.29b ± 0.07 |
2.46bc ± 0.14 |
|
T1 |
---- |
1.68c ± 0.02 |
2.29c ± 0.02 |
2.43c ± 0.02 |
2.67c ± 0.01 |
|
|
T2 |
---- |
1.63bc ± 0.02 |
2.15b ± 0.04 |
2.18b ± 0.04 |
2.31b ± 0.10 |
|
|
T3 |
---- |
1.49a ± 0.01 |
1.61a ± 0.01 |
1.63a ± 0.01 |
1.66a ± 0.01 |
|
|
Biomass (g) |
C |
74.47a ± 2.03 |
140.20ab ± 7.32 |
252.50b ± 8.72 |
296.90bc ± 20.05 |
359.31bc ± 46.28 |
|
T1 |
72.83a ± 0.49 |
160.70c ± 3.57 |
295.10c ± 4.55 |
341.30c ± 4.55 |
431.65c ± 6.21 |
|
|
T2 |
74.90a ± 0.67 |
153.10bc ± 2.98 |
257.30b ± 10.00 |
267.20b ± 10.31 |
304.55b ± 32.35 |
|
|
T3 |
74.47a ± 1.19 |
133.80a ± 1.04 |
149.50a ± 0.89 |
153.40a ± 1.11 |
157.56a ± 1.64 |
|
Table 8: Effect of supplementary feeding in biofilm rearing system on variation of different growth parameters of E. suratensis at fortnight intervals during 60 days of an experimental.
Values are expressed in mean ± error
a ,b, c, d mean values in a clolumn with different superscripts differ significantly for each parameter (p < 0.05)
1ABW, Average body weight; 2ABL, Average body length; 3DWG, Daily weight gain; 4PWG, Percentage weight gain and 5SGR, Specific growth rate
C = No Biofilm + feed; T1= Biofilm + Feed; T2= Biofilm + Reduced feed and T3 = Biofilm + No feed
The initial Average Body Weight (ABW), Daily Weight Gain (DWG), Percentage Weight Gain (PWG), Specific Growth Rate (SGR) and biomass of E. surantensis among different treatments followed a similar trend during 60 days of the experiment. On the 15th day after stocking, these parameters were recorded significantly higher (P ≤ 0.05) in T1 compared to T3 and control. At the same time, there was an insignificant difference (P ≥ 0.05) observed between T3 and control as well as between T1 and T2. At the time of sampling on the 30th day after stocking, the mentioned growth parameters were also significantly highest (P ≤ 0.05) in T1, followed by T2, and control, with significantly lowest (P ≤ 0.05) in T3. Later, on the 45th day after stocking, the given parameters were observed significantly highest (P ≤ 0.05) in T1 and significantly lowest (P ≤ 0.05) in T3 with no significant difference (P ≥ 0.05) between the control group and T2. Finally, the significant (P ≤ 0.05) highest parameters mentioned were observed in T1 and the lowest in T3 with no significant difference (P ≥ 0.05) of a control group with either T1 or T2 at the end of 60 days experiment.
Except for the 15th day after stocking, the initial Average Body Length (ABL) of E. surantensis followed a similar trend as previously indicated parameters. Where it was recorded as significantly higher (P ≤ 0.05) in T1 compared to T3 but insignificant (P ≥ 0.05) difference (P ≥ 0.05) between T2 and control with either T1 or T3.
The significantly lower (P ≤ 0.05) Feed Conversion Ratio (FCR) was recorded in T2 (1.51 ± 0.11) compared to T1 and control. The significantly highest (P ≤ 0.05) quantity of feed was provided to the T1 group followed by the control and T2 There was no significant difference (P ≥ 0.05) observed for survival rate (%) among all treatments in the 60 days of the experiment.
Economic analysis
The total fixed cost on various equipment viz. FRP tanks, air pump, and bird fencing net used for the experiments were calculated as INR 123.50 tank-1 (Table 9). The total fixed cost was the same for all experiment groups. When calculating fixed costs, the durability of the FRP tank is assumed to be 15 years; the durability of the air pumps was assumed to be 5 years, and the durability of the bird fencing net and other accessories is assumed to be 2 years. The cost of recurring materials like the seed, water, and electricity was common for all experiment tanks and calculated as INR 365.83 tank-1 (Table 10). The cost of feed and manpower varies among treatment-wise variable costs. The highest cost on feed was calculated in T1 (INR 79.20 tank-1) followed by control (INR 69.30 tank-1) and T2 (INR 40.50 tank-1), while there was no cost on feed in T3 (Table 11). The gross returns were found to vary among different experimental groups assuming ornamental market price as INR 20.0 for 5-7 g; INR 25.0 for 7-12 g and INR 30.0 for 12-20 g size of E. suratensis. The highest gross returns were calculated in T1 (INR 900.00) and the lowest in T3 (INR 593.40). Whereas gross profit was found similar in T2 (INR 750.00) and control (INR 750.00) (Table 12). The total cost for one crop per tank was recorded as highest in T1 (INR 738.76) followed by control (INR 723.76), T2 (INR 700.06) and lowest in T3 (INR 509.56) (Table 13). The highest net profit of one crop per tank was recorded in T1 (INR 161.24) followed by T3 (INR 83.84), T2 (INR 49.94) and lowest in control (INR 26.24) experimental groups (Table 13).
Cash flow analysis of pearlspot biofilm rearing system in the different treatments is performed over 10 years in a unit of twelve tanks and represented in (Table 14). The cash flow analyses revealed a positive NPV value at an 8.5% discount rate in all treatments. The highest value of BCR was recorded in T1 (1.20) followed by T3 (1.09), T2 (1.05) and lastly in control (INR 1.02) (Table 14). The highest internal rate of return (IRR) was reported in T1 (22.89%), followed by T3 (13.94%), and T2 (12.18%), while the lowest value was determined in control (9.94%). PP and DPP were recorded in the ascending order of T1 (4.31, 5.47 years), T3 (5.87, 6.67 years), T2 (5.48, 7.07 years) and control (6.86, 9.22 years), respectively.
|
Sr. No. |
Particulars |
Unit cost (?) |
Units (?) |
Total (?) |
Durability (Years) |
Fixed cost (?) |
|
1. |
FRP tanks (500 L) |
6000.00 L @ ? 12 L-1 |
12 |
72000.00 |
15 |
4800.00 |
|
2. |
Air pump (60 L min-1), 55 W |
4900.00 unit-1 |
2 (* 1 stand by) |
9800.00 |
5 |
1960.00 |
|
3. |
Bird fencing net |
100 kg-1 |
3 |
300.00 |
2 |
150.00 |
|
4. |
Accessories (Electric equipment’s, aeration pipes, hand nets, cleaning equipment’s, buckets, etc) |
-- |
--- |
1000.00 |
2 |
500.00 |
|
Total (?): 83,100.00 |
7410.00 |
|||||
|
Cost per cycle (?): 16,620.00 |
1482.00 |
|||||
|
Cost per tank per cycle (?): 1385.00 |
123.50 |
|||||
Table 9: Total fixed cost for culture set up.
Assumptions:
- Culture period: 60 days
- Number cycles: 5 cycles year-1
- Number of culture units (Treatments X Replicates): 12
|
Sr. No. |
Particulars |
Unit cost (?) |
Units |
Total (?) |
|
1. |
Seed |
? 8 fry-1 |
360 |
2880.00 |
|
2. |
Brackishwater including evaporation losses |
? 50 L-3 |
4000 lit |
200.00 |
|
3. |
Electricity for aeration @ 55 W for 1440 hrs |
? 7.5 Unit |
79.2 |
594.00 |
|
4. |
Electricity for other work @ 20 W for 1440 hrs |
? 7.5 Unit |
28.8 |
216.00 |
|
5. |
Miscellaneous (Chemicals, Washing materials, etc) |
|
|
500.00 |
|
Total (?): |
4390 |
|||
|
Variable cost per tank (?): |
365.83 |
|||
Table 10: Common Variable cost for culture set up.
C = No Biofilm + feed; T1= Biofilm + Feed; T2= Biofilm + Reduced feed and T3 = Biofilm + No feed
|
Sr. No. |
Particulars |
Unit cost (?) |
Treatments |
|||||||
|
C |
T1 |
T2 |
T3 |
|||||||
|
Units |
Cost (?) |
Units |
Cost (?) |
Units |
Cost (?) |
Units |
Cost (? |
|||
|
1. |
Feed |
@ ? 90 kg-1 |
0.77 kg |
69.30 |
0.88 kg |
79.20 |
0.45 kg |
40.50 |
0.00 |
0.00 |
|
2. |
Lime |
@ ? 2 kg-1 |
15 g |
0.03 |
15 g |
0.03 |
15 g |
0.03 |
15 g |
0.03 |
|
3. |
Urea |
@ ? 6 kg-1 |
4.5 g |
0.03 |
4.5 g |
0.03 |
4.5 g |
0.03 |
4.5 g |
0.03 |
|
4. |
Cow dung |
@ ? 0.75 kg-1 |
90 g |
0.07 |
90 g |
0.07 |
90 g |
0.07 |
90 g |
0.07 |
|
5. |
Sugarcane bagasse |
Available free of cost |
0 |
0 |
800 g |
0 |
800 g |
0 |
800 g |
0 |
|
6. |
Manpower |
@ ? 30 man-hr-1 Feeding: 1 hr day-1 for 12 tanks Substrate preparation: 1 hr for 12 tanks Fertlization: 1 hr for 12 tanks Tank cleaning, stocking and harvesting: 6 hours for 12 tanks |
5.50 man-hr |
165.00 |
5.67 man-hr |
170.10 |
5.67 man-hr |
170.10 |
0.67 man-hr |
20.10 |
|
Total cost per treatment (?): |
234.43 |
249.43 |
210.73 |
20.23 |
||||||
Table 11: Treatment wise variable cost.
Given treatment-wise variable costs are calculated per unit tank in INR (?).
C = No Biofilm + feed; T1= Biofilm + Feed; T2= Biofilm + Reduced feed and T3 = Biofilm + No feed
|
Treatment |
Harvesting size |
Survival
|
Rate ? |
Gross returns ? |
|
|
Length (cm) |
Weight (g) |
||||
|
C |
8.41 |
11.97 |
30 |
25 |
750.00 |
|
T1 |
8.94 |
14.39 |
30 |
30 |
900.00 |
|
T2 |
8.05 |
10.15 |
30 |
25 |
750.00 |
|
T3 |
6.5 |
5.25 |
29.67 |
20 |
593.40 |
Table 12: Gross return analysis.
Assumption: Market price: ? 20.0 for 5-7 g; ? 25.0 for 7-12 g and ? 30.0 for 12-20 g
|
Treatments |
Economics analysis (?) |
||||||
|
Fixed cost |
Variable cost |
Total cost |
Gross returns |
Net returns |
|||
|
Common
|
Treatment-wise
|
Total Variable cost |
|||||
|
C |
123.50 |
365.83 |
234.43 |
600.26 |
723.76 |
750.00 |
26.24 |
|
T1 |
123.50 |
365.83 |
249.43 |
615.26 |
738.76 |
900.00 |
161.24 |
|
T2 |
123.50 |
365.83 |
210.73 |
576.56 |
700.06 |
750.00 |
49.94 |
|
T3 |
123.50 |
365.83 |
20.23 |
386.06 |
509.56 |
593.40 |
83.84 |
Table 13: Summary of financial analysis for one crop per tank of rearing E. suratensis in different culture systems.
Assumption: Market price: ? 20.0 for 5-7 g; ? 25.0 for 7-12 g and ? 40.0 for 12-20 g
All values are in INR
C = No Biofilm + feed; T1= Biofilm + Feed; T2= Biofilm + Reduced feed and T3 = Biofilm + No feed
|
Treatments |
Cost structure |
Period (years) |
Economic parameters |
||||||||||
|
0 |
1 |
2 |
3 |
4 |
5 |
6 |
7 |
8 |
9 |
10 |
|||
|
Common for all treatments |
Capital cost |
|
|
||||||||||
|
FRP tanks |
72000 |
|
|
|
|
|
|
|
|
|
|
||
|
Air pump |
9800 |
|
|
|
|
4900 |
|
|
|
|
4900 |
||
|
Bird fencing net |
300 |
|
300 |
|
300 |
|
300 |
|
300 |
|
300 |
||
|
Accessories |
1000 |
|
1000 |
|
1000 |
|
1000 |
|
1000 |
|
1000 |
||
|
Total |
83100 |
|
1300 |
|
1300 |
4900 |
1300 |
|
1300 |
|
6200 |
||
|
C |
Variable cost |
0 |
36016 |
36916 |
37839 |
38785 |
39755 |
40749 |
41767 |
42811 |
43882 |
44979 |
NPV = 6404 IRR = 9.94% BCR = 1.02 PP (Years) = 6.86 DPP (Years) = 9.22 |
|
Total cost |
83100 |
36016 |
38216 |
37839 |
40085 |
44655 |
42049 |
41767 |
44111 |
43882 |
51179 |
||
|
Gross profit |
0 |
45000 |
47250 |
49613 |
52093 |
54698 |
57433 |
60304 |
63320 |
66485 |
69810 |
||
|
Net profit |
-83100 |
8984 |
9034 |
11773 |
12008 |
10043 |
15384 |
18537 |
19208 |
22604 |
18631 |
||
|
PV |
-83100 |
8280 |
7674 |
9217 |
8665 |
6679 |
9430 |
10472 |
10001 |
10847 |
8240 |
||
|
T1 |
Variable cost |
0 |
36916 |
37839 |
38785 |
39754 |
40748 |
41767 |
42811 |
43881 |
44978 |
46103 |
NPV = 71786 IRR= 22.89% BCR = 1.20 PP (Years) = 4.31 DPP (Years) = 5.47 |
|
Total cost |
83100 |
36916 |
39139 |
38785 |
41054 |
45648 |
43067 |
42811 |
45181 |
44978 |
52303 |
||
|
Gross profit |
0 |
54000 |
56700 |
59535 |
62512 |
65637 |
68919 |
72365 |
75983 |
79783 |
83772 |
||
|
Net profit |
-83100 |
17084 |
17561 |
20750 |
21457 |
19989 |
25852 |
29554 |
30802 |
34804 |
31469 |
||
|
PV |
-83100 |
15746 |
14918 |
16246 |
15483 |
13294 |
15846 |
16696 |
16038 |
16702 |
13918 |
||
|
T2 |
Variable cost |
0 |
34594 |
35459 |
36345 |
37254 |
38185 |
39140 |
40118 |
41121 |
42149 |
43203 |
NPV = 16687 IRR= 12.18% BCR = 1.05 PP (Years) = 6.34 DPP (Years) = 8.34 |
|
Total cost |
83100 |
34594 |
36759 |
36345 |
38554 |
43085 |
40440 |
40118 |
42421 |
42149 |
49403 |
||
|
Gross profit |
0 |
45000 |
47250 |
49613 |
52093 |
54698 |
57433 |
60304 |
63320 |
66485 |
69810 |
||
|
Net profit |
-83100 |
10406 |
10491 |
13267 |
13539 |
11613 |
16993 |
20186 |
20898 |
24336 |
20407 |
||
|
PV |
-83100 |
9591 |
8912 |
10387 |
9770 |
7723 |
10416 |
11404 |
10881 |
11678 |
9026 |
||
|
T3 |
Variable cost |
0 |
23164 |
23743 |
24336 |
24945 |
25569 |
26208 |
26863 |
27534 |
28223 |
28928 |
NPV = 24283 IRR= 13.94% BCR = 1.09 PP (Years) = 5.87 DPP (Years) = 7.67 |
|
Total cost |
83100 |
23164 |
25043 |
24336 |
26245 |
30469 |
27508 |
26863 |
28834 |
28223 |
35128 |
||
|
Gross profit |
0 |
35604 |
37384 |
39253 |
41216 |
43277 |
45441 |
47713 |
50098 |
52603 |
55233 |
||
|
Net profit |
-83100 |
12440 |
12341 |
14917 |
14971 |
12808 |
17933 |
20850 |
21264 |
24380 |
20105 |
||
|
PV |
-83100 |
11466 |
10483 |
11679 |
10803 |
8518 |
10992 |
11779 |
11071 |
11700 |
8892 |
||
Table 14: Cash flow (INR) analysis for pearlspot fingerling production in biofilm system among different treatments for unit of twelve tanks.
Assumptions: Increase of variable cost @ 2.5 % per year; increase of gross income @ 5 % every year; discount rate, 8.5 %
PV, Present Value; NPV, Net Present Value and IRR, Internal Rate of Return
C = No Biofilm + feed; T1= Biofilm + Feed; T2= Biofilm + Reduced feed and T3 = Biofilm + No fee
Discussion
Impact of supplementary feeding on water quality parameters biofilm rearing system of E. suratensis
Temperature, pH, dissolved oxygen, alkalinity, ammonia, nitrite-N, and nitrate-N were all found to be within the optimum range of requirements for fish in all experimental groups, as suggested by many authors. Temperature is an important factor in regulating animal metabolism. The optimal water temperature range is required for normal metabolic activity and maximum fish yield. The temperature range observed in the present study was 23.0 °C to 26.0 °C, which was within the optimum range for cichlids [32]. pH was found in the optimum range in all treatments as required by the species. There was no significant difference in overall pH observed in culture tanks among different treatments during the experiment except for minor variation during the 15th and 45th days after stocking (Table 3). An inherent assumption in most biofilm models was that the pH remains constant within the biofilm and the decrease in pH in biofilm systems might result in CaCO3 consumption and the release of CO2 and H+ into the culture medium [33]. E. suratensis is essentially a brackish water fish and thrives well in freshwater and brackish water [34]; hence, the salinity 5 PSU was maintained in the all-experimental groups within a tolerable range of fish. Dissolved Oxygen (DO) level was recorded above 4.00 mg L-1 throughout the experiment and found within a tolerable range of fish for optimum fish, shrimp, microbiota respiration, and growth, as prescribed for microbial systems like biofloc by [35]. The increased bacterial load and chlorophyll-a content in the water could account for the reduced DO level on the 45th day after stocking in full-fed substrate addition treatment (Tables 3 & 5). The decrease in DO in the biofilm culture system might be attributed to heterotrophic food synthesis consuming the bulk of oxygen [36]. Quickly biodegradable sugarcane bagasse as a natural substrate may also cause decreased DO in the biofilm treatment group on the 45th day after stocking. In this regard, [23] previously observed a decrease in DO due to the addition of natural substrate. Nonfed biofilm treatment demonstrated greater DO than full-fed biofilm treatment and control at the end of the trial, possibly due to lower fish biomass combined with lower bacterial load, Chlorophyll-a, and Pheophytin-a content in the water. [36] observed that microorganisms in aquaculture ponds absorb the majority of oxygen, which supported our findings. In a previous experiment, [37] found that in addition to DO utilisation from the floc organism, fish biomass was also responsible for reduced DO levels in the biofloc system. The alkalinity of water in all the experimental groups ranged from 95.07 ± 13.85 mg L-1 to 96.57 ± 15.10 mg L-1, which was within the acceptable range for microbial aquaculture systems as suggested by [35]. The total ammonia-nitrogen levels were similar at the stocking time; however, the control had a higher ammonia level by the 30th day of the trial. The higher level of total ammonia-nitrogen in the control group from the 30th to 45th days of the experiment correlated to a lower bacterial load, indicating less heterotrophic food production than in the experimental biofilm groups (Tables 2 & 4). According to [38], the decrease in ammonium concentrations has been mostly due to an increase in chlorophyll-a in biofilms as microalgae absorb the ammonium to produce new biomass. The nitrite-nitrogen level was found significantly higher in control on the 15th day after stocking and at the end of the experiment compared to other substrate-based treatment groups except for T1. The present study showed more or less variation in nitrate-nitrogen levels among experimental groups during the experimental period. However, a significantly higher level of nitrate-nitrogen from the 45th day onwards was recorded in T1 followed by T2 and lower in T3 and control, which indicates that nitrifying bacteria present in the biofilm played an important role in nitrate-nitrogen variation. Increased bacterial count on nutrient-rich plant substrates could explain the lower total ammonia-nitrogen and higher nitrate-nitrogen levels in substrate-based treatments [39-42]. In many aquaculture systems, supplemental feeding was found to cause elevated total ammonia and nitrite nitrogen levels [43]. The total ammonia-nitrogen level and nitrite-nitrogen at the end of the present investigation were found significantly higher in T1 and control due to high feeding intensity than in T3 and T2. Overall, studies of water quality parameters in a biofilm rearing system at different feeding levels demonstrated that a heterotrophic microbial-based production system provides more stable water quality than a phytoplankton-based production system, according to [44].
Chlorophyll-a, pheophytin and bacterial biomass production in the system
Chlorophyll-a is the major photosynthetic pigment in many phytoplankton species and a trophy index in aquatic ecosystems [45]. No significant difference (P≥0.05) in the chlorophyll-a concentration in water was recorded up to one month of the experimental period among different treatments (Table 5) (Figure 2). However, chlorophyll-a concentration was significantly higher (P≤0.05) in full supplementary feeding groups i. e. T1 and control on the 45th day after stocking. The chlorophyll-a content in the water is affected by nutrients such as ammonia, nitrite and nitrate [46] and also depends on the quantity of supplementary feeding [43]. The full supplementary feeding substrate-based treatment (T1) showed a higher chlorophyll-a concentration at the end of the experiment than other experimental groups, which was consistent with a concentration higher total ammonia-nitrogen, nitrite-nitrogen, nitrate-nitrogen and bacterial load. The current study showed no significant difference in bacterial load until the 15th day after stocking. After one month of the trial, however, the biofilm-based experimental group with full supplementary feed had a greater bacterial load in water than the other groups. In a biofilm-based aquaculture system, the increased bacterial population in the water column and sediment could cause increased feed and increased biomass of cultivated species over time [47]. Increased bacterial load causes higher breakdown rates, releasing inorganic nutrients and stimulating bacterial growth in the water column and substrate [40].
Most chlorophyll molecules in living algae have not been destroyed (e.g., Chlorophylla-a alone or with Chlorophylla-b or Chlorophylla-c). However, pheophytin-a is one of the most commonly occurring breakdown products of chlorophyll-a, which occurs due to cell senescence, death, or the presence of debris [48]. Pheophytin-a content in water in the present experiment remained unaffected by different feeding levels and substrate addition during the rearing of E. suratensis. Similar to our present study, [21] reported significantly higher chlorophyll-a content in pond water with no additional substrate and only supplementary feeding experiment group than in substrate added without supplementary feeding group during E. suratensis grow-out culture. The same author found no significant difference in water pheophytin-a content during E. suratensis cultivation, which is consistent with our findings. The results obtained in the present investigation revealed that supplementary feeding plays a vital role in the chlorophyll-a content in water during the rearing of E. surantensis in a biofilm-based system.
There was no significant difference (P≥0.05) in the overall mean values of both pigments in water as well as on substrate among different treatments observed during the present experiment (Table 5). Similarly, no significant difference was reported in mean pigment concentration between fed and nonfed tanks of periphyton grown on the substrate during the rearing of T. khudree and L. fimbriatus [49]. In another study, [50] reported a significantly higher value of periphyton biomass, dry matter and Ash-Free Dry Matter (AFDM) in periphyton treatment with supplementary feeding compared to only substrate-added treatment without supplementary feeding but values of pigment remain unaffected. There were no treatment effects or treatment–time interactions on chlorophyll-a noted by [51] during the production of three Indian Major Carps, and Labeo calbasu, in a periphyton-based polyculture system at different stocking combinations.
The peak concentration of chlorophyll-a in all substrate-added experimental groups was reported on the 15th day after stocking and subsequently gradually decreased over the remainder of the study. The maximal concentrations of pheophytin-a in T2 and T3 were measured on the 15th and 30th days after stocking, respectively. Similarly, in periphyton-based systems, a constant and persistent drop in chlorophyll-a concentration was seen during polyculture of Oreochromis niloticus with Macrobrachium rosenbergii [52] and carp polyculture [50]. [53] observed that pigment concentrations at various sampling dates and substrate depths followed varied patterns based on substrate types. The chlorophyll-a concentration, pheophytin-a concentration and bacterial biomass on the substrate were found to increase with increasing feeding levels in the present investigation (Table 15). There was a significant linear (P≤0.05) relationship representing a strong value of the coefficient of determination observed for chlorophyll-a (R2 = 1.00; RMSE = 0.0105), pheophytin-a (R2=0.9918; RMSE = 0.0900) and TPC (R2 = 0.9651; RMSE = 1.0939) present on the substrate with different feeding level in the biofilm rearing system (Table 15). During a 90-day trial of E. suratensis culture, [21] observed significantly higher epilithic chlorophyll-a and pheophytin-a values in ponds with no additional substrate and only supplementary feeding than in the substrate-added group without supplementary feeding. As a result, these findings revealed that variation in the value of chlorophyll-a and pheophytin-a content on the substrate was species-specific and positively affected by supplementary food during E. suratensis rearing.
|
Growth parameter (y) with feeding level (x) |
Type of relationship |
Equation |
Coefficient of determination (R2 ) |
Root mean square error (RMSE) |
Significance (p value) |
|
1DWG |
Linear |
y = 0.0015x + 0.0474 |
0.9942 |
0.0048 |
0.049 |
|
2PWG |
Linear |
y = 4.8201x + 13.578 |
0.9997 |
3.3071 |
0.011 |
|
3SGR |
Linear |
y = 0.0102x + 1.6716 |
0.9976 |
0.0208 |
0.031 |
|
Biomass |
Linear |
y = 2.7179x + 152.96 |
0.9947 |
8.1783 |
0.47 |
|
Chlorophyll-a |
Linear |
y = 0.0363x + 1.1558 |
1.0000 |
0.0105 |
0.004 |
|
Pheophytin-a |
Linear |
y = 0.0241x + 1.4305 |
0.9918 |
0.0900 |
0.058 |
|
4TPC |
Linear |
y = 0.14x + 6.3447 |
0.9651 |
1.0939 |
0.120 |
Table 15: Relationship of different feeding levels (%) with growth parameters of E. suratensis and pigments and total plate count on substrate in biofilm-based rearing system.
1DWG, Daily weight gain; 2PWG, Percentage weight gain; 3SGR, Specific growth rate and 4TPC, Total plate count
The bacterial load in terms of TPC on substrates was also found to be positively affected by different feeding levels in substrate-based treatments showing a significantly higher level of overall mean values in T1 and T2 than observed in T3 (Tables 4 & 15). The increased bacterial count in the water column and sediment might cause increased feed and increased biomass of cultured species over time in a biofilm-based aquaculture system [47]. Only a portion of the nutrients in the feed is assimilated and retained in the body of cultured animals and the rest of the nutrients are released in the water column. Feeding groups of the present investigation showed increased bacterial load on substrate since organic-rich particles and aggregates in the form of film or floc provided a suitable habitat for microorganisms to take up nutrients, and shelter from predators, as well as from destructive physical factors [54,13]. The higher bacterial count on the substrate than in the water column may as a condition of biofilm accommodate higher bacterial abundance than the adjacent water column [55]. Due to water movement in the fish rearing unit, organic matter agglomerates and forms the film or aggregates on the substrate [56,57], which might facilitate bacterial settlement and proliferation.
Effect of supplementary feeding on growth parameters of E. suratensis reared in the biofilm-based system
Fish growth was observed in descending order of T1, control, T2, and finally T3 in terms of final length, final weight, biomass, DWG, PWG, and SGR, implying that supplementary feeding improved growth parameters in the biofilm-based rearing system of E. suratensis. The performance of growth parameters of control was found between T1 and T2, which showed the marginal positive effect of the biofilm rearing system. However, the effect of the biofilm rearing system with full supplementary feeding showed a significant effect in comparison to full feeding without biofilm group on parameters up to 45 days and thereafter reduced may be due to decreased algal bacterial biomass measured in terms of chlorophyll-a, pheophytin-a and TPC in the culture system. The growth parameters such as DWG (R2 = 0.9942; RMSE = 0.0048), PWG (R2 = 0.9997; RMSE = 3.3071), SGR (R2 = 0.9976; RMSE = 0.0208) and biomass (R2 = 0.9947; RMSE = 8.1783) showed a significant positive linear relationship with increased feeding level representing a strong value of the coefficient of determination in the substrate-based treatments (Table 15). Similar kinds of significantly increased growth performance through supplementary feeding were reported in Tor khudree and Labeo fimbriatus cultured in a biofilm-based culture system [49]. Another experiment on pearlspot culture in low volume cages revealed higher growth performance in terms of final weight, biomass and PWG in supplementary feeding with substrate group followed by only supplementary feeding without the substrate group than in only the substrate group [58].
In the present investigation, growth parameters were also found to be related to the level of chlorophyll-a, pheophytin-a-a and TPC available on the substrate. DWG was found to have strong values of coefficient of determination showing significant (P≤0.05) positive power relationships with chlorophyll-a (R2 = 0.9956; RMSE = 0.0060), significant (P≤0.05) positive exponential relationships with pheophytin-a (R2 = 0.9999; RMSE = 0.0008), and marginal insignificant (P≥0.05) positive linear relationships with TPC (R2 = 0.9317; RMSE = 0.0160). PWG was found to have a positive linear relationship with chlorophyll-a (R2 = 0.9888; RMSE = 16.4926), a power relationship with pheophytin-a, (R2 = 0.9900; RMSE = 23.5628) and an exponential relationship with TPC (R2 = 0.9909; RMSE = 22.4322), all of which showed a strong value for the coefficient of determination with marginally insignificant at a 5% probability level (Table 16). The positive significant (P≤0.05) linear relationship showing high values of coefficient of determination was reported for SGR with chlorophyll-a (R2 = 0.9982; RMSE = 0.0177); with pheophytin-a content; (R2 = 0.9983; RMSE = 0.1766) and with TPC (R2 = 0.9809; RMSE = 0.0577) available on the substrate. The relationship between chlorophyll-a (R2 = 0.9962; RMSE = 7.4049) and pheophytin-a (R2 = 0.9987; RMSE = 4.2539) present on the substrate with fish biomass was exponential and significant at a 5% level of probability representing the strong value of the coefficient of determination. However, the relationship between TPC (R2 = 0.9741; RMSE = 18.6950) on the substrate with fish biomass is exponential with a strong value of the coefficient of determination but marginally insignificant at a 5% level of probability (Table 16).
|
Growth parameter (y) |
Pigments/TPC (x) |
Type of relationship |
Equation |
Coefficient of determination (R2 ) |
Root mean square error (RMSE) |
Significance (p value) |
|
1DWG |
Chlorophyll-a |
Power |
y = 0.0432x0.9547 |
0.9956 |
0.0060 |
0.042 |
|
Pheophytin-a |
Exponential |
y = 0.0224e0.5836x |
0.9999 |
0.0008 |
0.006 |
|
|
4TPC |
Linear |
y = 0.0101x - 0.0128 |
0.9317 |
0.0160 |
0.168 |
|
|
2PWG |
Chlorophyll-a |
Linear |
y = 103.63x - 16.572 |
0.9888 |
16.4926 |
0.068 |
|
Pheophytin-a |
Power |
y = 69.065x1.435 |
0.9900 |
23.5628 |
0.064 |
|
|
4TPC |
Exponential |
y = 60.015e0.1053x |
0.9909 |
22.4322 |
0.061 |
|
|
3SGR |
Chlorophyll-a |
Linear |
y = 0.2797x + 1.3482 |
0.9982 |
0.0177 |
0.027 |
|
Pheophytin-a |
Linear |
y = 0.4207x + 1.0717 |
0.9983 |
0.1766 |
0.026 |
|
|
4TPC |
Linear |
y = 0.0707x + 1.237 |
0.9809 |
0.0577 |
0.000 |
|
|
Biomass |
Chlorophyll-a |
Exponential |
y = 115.69e0.2795x, |
0.9962 |
7.4049 |
0.034 |
|
Pheophytin-a |
Exponential |
y = 87.668e0.4208x, |
0.9987 |
4.2535 |
0.019 |
|
|
4TPC |
Exponential |
y = 103.32e0.0708x |
0.9741 |
18.6950 |
0.081 |
Table 16: Relationship of different growth parameters with pigments and TPC developed on substrate in the biofilm-based rearing system of E. suratensis.
1DWG, Daily weight gain; 2PWG, Percentage weight gain; 3SGR, Specific growth rate and 4TPC, Total plate count
The fish biomass yield was 173.96% higher in full supplementary feeding with biofilm treatment, 93.58% higher in partially fed fishes with biofilm treatment and 128.05% higher in full-feeding fishes without biofilm group than in the nonfed fishes with experimental biofilm group (Table 17). While, the increment was 20.13% higher in full supplementary feeding with biofilm treatment, 15.12% lower in partially fed fishes with biofilm treatment and 56.15% lower in nonfed fishes with biofilm group than in the full-feeding fishes without biofilm group (Table 17). [59], observed that a combination of substrates and feeding resulted in 71% and 54% higher production of mahseer and 85% and 87% higher production of fringe-lipped carp than in control at higher and lower density, respectively. During the culture of E. suratensis in inland saline ponds, [21] found that providing the substrate without supplementary feeding resulted in 24% higher growth than feed ponds and nearly 100% higher growth to control ponds without substrate and supplementary feeding. [59,60] have reported 35.4% higher growth in Mugil cephalus and 72.5% in Chanos chanos when grown in inland saline groundwater ponds with the substrate. Numerous research outputs are available related to the beneficial effect of the addition of substrate in biofloc systems. [25] observed 2.4 times the greater final weight and a 59.19% increase in productivity of O. niloticus reared with the biofilm than without biofilm. [52] observed that the individual weight gain of tilapia increased by 30% due to the addition of substrates and a 40% higher net yield of tilapia in monoculture and 56% in polyculture with freshwater prawns. The addition of artificial substrates in the culture system increased the growth performance of Penaeus monodon [12]; and Lit openaeus vannamei [61-63]. Similar to the present study, [64] reported lower growth performance of shrimp cultured without supplementary feeding in a biofloc system, which was independent of the addition of biofilm. [65] found a similar growth performance of Farfant epenaeus brasiliensis postlarvae reared with or without supplementary feed in biofloc conditions during 30 days of the nursery phase, which was 40% more than the conventional clear water continuous exchange system. The substrate addition with full feeding was not always impacted by significantly higher (P≤0.05) growth than without substrate added and full feeding group, as observed in the present investigation. These findings are in line with [66], who found that using artificial substrates had no impact on the mean body weight or weight gain of F. brasiliensis grown in a periphyton nursery system. Similarly, [67] demonstrated that using vertically or horizontally placed substrates did not provide any advantage during the nursery culture of Metapenaeus monoceros.
|
Parameter |
Treatment |
|||
|
C |
T1 |
T2 |
T3 |
|
|
Final biomass (g) |
359.31 |
431.65 |
305.00 |
157.56 |
|
Increment of biomass over unfed with added substrate group (g) |
201.75 |
274.09 |
147.44 |
0 |
|
Increment of biomass over full fed without added substrate group (g) |
0 |
72.34 |
-54.31 |
-201.80 |
|
% Increment of biomass over unfed with added substrate group |
128.05 |
173.96 |
93.58 |
0 |
|
% Increment of biomass over full fed without added substrate group |
0 |
20.13 |
-15.12 |
-56.15 |
|
1FCR |
2.22 |
2.03 |
1.51 |
--- |
|
Improvement of FCR over full fed without added substrate group (g) |
0 |
0.19 |
0.71 |
2.22 |
|
% Improvement of FCR over full fed without added substrate group |
0 |
8.56 |
31.98 |
--- |
Table 17: Comparative improvement of growth parameters of E. suratensis among different treatments.
1FCR, Food conversion ratio
C= No Biofilm + feed; T1= Biofilm + Feed; T2= Biofilm + Reduced feed and T3= Biofilm + No feed
The value of FCR was found significantly lower (P≤0.05) in partial-feeding fishes than in full-feeding experimental groups either in substrate added or without substrate treatments. The value of FCR did not significantly differ between full-feeding experimental groups with the added substrate or without substrate groups, however, the observed value in the substrate-added group was marginally less. Compared to full-feeding fishes without added substrate (control), the FCR was improved by 8.56% and 31.98% in full-feeding and partially-feeding fishes, respectively (Table 17). According to [21], the biofilm technology was found to help reduce the Feed Conversion Ratio (FCR) during pearlspot grow-out culture. [49] found lower FCR values in tanks with the substrate during the culture of T. khudree and L. fimbriatus. [52] observed an improved food conversion ratio of tilapia by 32% due to the addition of substrate for biofilm formation. Another study by the same author found 13% lower FCR in fed periphyton-based ponds compared to substrate-free fed ponds during the polyculture of tilapia with freshwater prawns. The presence of additional shelter and natural food in the form of periphyton established on substrates, as well as improvements in environmental conditions through a variety of ecological and biological processes, contribute to better growth, survival, and FCR in the biofilm system [68-71]. Similar reports of improved FCR are also available in the biofloc, an algal-bacterial system. [64] found improved FCR in low feeding rate treatment in the biofilm-added experimental group compared to other higher feeding rate groups during the rearing of L. vannamei in the biofloc culture system. Similarly, [72] reported a 30% reduction in conventional feed due to shrimp intake of biofloc. In another investigation, [73] found that biofloc contributed more than 29% of the daily food consumption of L. vannamei. Furthermore, [74] estimated 20% better feed utilization in biofloc systems than in conventional water exchange systems.
There was no significant difference in the survival of E. suratensis observed in the present investigation among all experimental groups. The survival of E. suratensis was not affected by reducing feed in the biofilm rearing system or in between added substrate or substrate-free treatments at the rearing density of 100 fish m-3. Similarly, during the growth study of T. khudree and L. fimbriatus in a biofilm-based culture system, [49] found that feed had no significant effect on survival and resulted in higher production. [52] reported that ponds with substrate and/or feed had greater tilapia and freshwater prawn survival and net yields than ponds without feed and substrate. Similarly, [64] found that no feed treatment, whether with or without biofilm treatment, resulted in considerably lower survival during the rearing of L vannamei in the biofloc culture system. The findings of the same authors are consistent with the current study's findings, which showed satisfactory survival at decreased feeding rates. These research outcomes suggest that fish could be grown in a biofilm system with a lower ration while achieving a better FCR and a higher survival rate. No significant difference was observed in the survival of nonfed fishes compared to other fed groups in the current investigation. Thus, it can be determined that at a stocking density of 100 numbers of E. suratensis fry m-3, natural food production in the biofilm-based system was adequate to supply the vital energy for their survival.
Similarly, [75], observed survival of L. vannamei between 90.7% and 97.3% in the total absence of artificial feed for 40 days and using only a biofilm food source in a zero-water exchange system. Also, [21] reported no significant difference in E. suratensis survival among the ponds with additional substrate and no supplementary feeding; ponds with no additional substrate and only supplementary feeding; and ponds with no additional substrate and no supplementary feeding. [76], on the other hand, found a nearly 60% drop in survival when no food was provided to L. vannamei and only biofilm-deposited artificial substrates acted as a feed for shrimp juveniles for 38 days at a stocking density of 32 shrimp m-2. The findings of current research are in line with those of [77], who discovered that shrimp, L. vannamei, exhibited increased growth and survival in biofilm and biofloc made up of either autotrophic or heterotrophic organisms in combination with formulated feed.
Overall, the results of the growth study in the present investigation demonstrated that E. suratensis advanced fry reared in a biofilm rearing system with full supplementary feeding exhibited improved growth performance.
Impact of supplementary feeding on the economics of biofilm-based rearing system of E. suratensis
In the present study, the Benefit-Cost Ratio (BCR) was the highest rank in T1 (1.20), where full supplementary feed was provided in the biofilm-based system, followed by T3 (1.09), where supplementary feed was not provided in the biofilm-based system, then in T2 (1.05), where the partial supplementary diet was provided in the biofilm-based system and lastly in control (1.02) where full supplementary feed was provided in substrate less system as presented in (Table 13). The justification of a higher BCR in T1 is attributed to higher growth and corresponding better fish prices. BCR in T3 and T2 were found better than in control, even though the growth of fish was less. This was in arrears of comparatively higher feed cost involved in control.
IRR is the interest rate calculated by dividing the present value of total costs by the present value of total revenues. When the IRR value exceeds the opportunity cost of capital, a business is said to be feasible. Based on the highest IRR value in the system, the current investigation determined that a biofilm rearing system with full supplementary feeding was financially more feasible. On the other hand, reduced supplemented feeding in the biofilm rearing system was discovered to have a substantial negative impact on financial feasibility as measured by lower IRR values (Table 14).
[52], noted that bamboo substrate was one of the major input costs for the biofilm rearing system. However, sugarcane bagasse was used as a substrate in the present experiment and was available free of cost in the local sugar juice vending shop. As a result, sugarcane bagasse-added treatment with full or partial feed outperformed full feeding without bagasse-added treatment, indicating that expensive bamboo can be replaced with less expensive sugarcane bagasse as an alternate substrate. Similarly, despite increased growth in bamboo stick ponds, [78] observed that carp in rice straw ponds performed better economically than those in bamboo stick ponds.
[8] reported that substrate-based cage aquaculture of O. niloticus resulted in the production of up to 52 kg m-3 using 32% less diet in a period almost 20% shorter than in the without substrate group. The same authors further recorded that the production capacity of 80 kg m-3 of O. niloticus with 30% less diet but the production period would be 20% longer than the substrate-less conventional culture technique. In another investigation, [9] found the cost of cultivation was significantly reduced by 31.25 to 37.09% in the periphyton technology compared to the fertilizer and feed with a higher net return of 45 to 58% higher than fertilizer alone experiments.
Moreover, the use of artificial substrate was found to reduce the feeding rate to 60% and has been reported for both early tilapia grow-out [71] and in a tilapia nursery [6]. The successful combination of biofilm with feeding will depend on the extra weight gain, substrate cost, feed cost and the selection of fish species [49].
Thus, the economic analysis of the present experiment revealed that biofilm-based pearlspot rearing could increase profit through supplementary feeding more than the conventional supplementary feeding method [79].
Conclusion
All water quality parameters remained in the optimum range as required by species through supplementary feeding in a biofilm-based rearing system. DO level was found to be affected by bacterial load, chlorophyll-a and pheophytin content in the culture tanks. The increased bacterial count in the water column and substrate could be attributed to the increased amount of feed and concurrently increased biomass of cultured species in a biofilm-based aquaculture system over time. The growth parameters were increased with increasing feeding levels in the substrate-based treatments. The results of the growth study demonstrated that E. suratensis advanced fry reared in a biofilm rearing system with full supplementary feeding exhibited improved growth performance. The economical parameters were found better in a biofilm rearing system with full supplementary feeding. Thus, based on the result obtained in the present investigation it can be concluded that biofilm-based rearing can increase the growth performance of E. suratensis and economical returns through supplementary feeding in biofilm-based rearing systems in tanks.
Declarations
- Ethical approval
Not applicable.
Competing interests
The authors declare no conflict of interest
Authors’contribution
S.R.Y. performed the work as part of his Ph. D. research work; B.R.C. provided technical support, drafted the manuscript and provided overall guidance; N.K.C. conceptualized and designed the experiment; S.D.N. supported with experimental facilities; K.K.K. assisted in laboratory analysis; and P.B.S. extended help with statistical analysis.
Funding
This research did not receive any specific grant from funding agencies in the public, commercial, or not-for-profit sectors.
Availability of Data and Materials
All the required data are available in the manuscript.
Research Content
The research content of the manuscript is original and has not been published elsewhere.
Consent to Publish
All authors agree to publish the paper in Aquaculture Economics and Management.
Acknowledgment
The author is grateful to Vice-chancellor, Maharashtra Animal and Fishery Sciences University, Nagpur, for sanctioning study leave to pursue a doctoral degree. The author is also thankful to the Director, ICAR- Central Institute of Fisheries Education (CIFE), Mumbai, and Vice-chancellor, Dr. Balasaheb Sawant Konkan Krishi Vidyapeeth, Dapoli, for providing permission and necessary research facilities at the College of Fisheries, Ratnagiri.
References
- Piedrahita RH (2003) Reducing the potential environmental impact of tank aquaculture effluents through intensification and recirculation. Aquaculture 226: 35-44.
- Gross A, Boyd CE, Wood CW (2000) Nitrogen transformations and balance in channel catfish ponds. Aqua Eng 24: 1-14.
- Tomasso JR (1994) Toxicity of nitrogenous wastes to aquaculture animals. Rev in Fisheries Sci 2: 291-314.
- Ostrenskya A, Wasielesky WJr (1995) Acute toxicity of ammonia to various life stages of the S3o Paul0 shrimp, Pkrez-Farfante 1967.
- Pandey PK, Vivekanand B, Kundan K (2014) Biofilm in aquaculture production. Afr J Microbiol Res 8: 1434-1443.
- Milstein A, Peretz Y, Harpaz S (2008) Culture of organic tilapia to market size in periphyton-based ponds with reduced feed inputs. Aqua Res 40: 55-59.
- Gangadhar B, Sridhar N, Umalatha, Hegde N, Manjappa K, et al. (2016) Growth performance and digestive enzyme activities in the fringe-lipped carp, Labeo fimbriatus in nursery rearing under periphyton enhanced conditions. Indian J of Fisheries 63.
- Garcia F, Romera DM, Sousa NS, Ramos IP, Makoto Onaka E, et al. (2016) The potential of periphyton-based cage culture of Nile tilapia in a Brazilian reservoir. Aqua 464: 229-235.
- Ghosh S, Sahu NC, Rahaman FH, Das KS (2019) Periphyton Based Climate Smart Aquaculture for the Farmers of Indian Rural Sunderban Areas. Indian Research Journal of Extension Education 19: 60-72.
- Xuemei W, Jingling L, Muyuan M, Zhifeng Y (2010) Response of Freshwater Biofilm to pollution and ecosystem in Baiyangdian Lake of China. Procedia Environ Sci 2: 1759-1769.
- Azim ME, Verdegem MCJ, Singh M, Van Dam A, Beveridge M (2003) The effects of periphyton substrate and fish stocking density on water quality, phytoplankton, periphyton and fish growth: Effects of fish grazing on periphyton. Aquaculture Research 34: 685-695.
- Arnold SJ, Coman FE, Jackson CJ, Groves SA (2009) High-intensity, zero water-exchange production of juvenile tiger shrimp, Penaeus monodon: An evaluation of artificial substrates and stocking density. Aquaculture 293: 42-48.
- Krishnani KK, Nagavel A, Kathiravan V, Ponnusamy K, Solanki HG, et al. (2013) Evaluation of bagasse assisted biostimulation in coastal aquaculture through field and molecular approaches 18.
- Yadav SR, Chavan BR, Chadha NK, Naik S, Kumar Krishnani K, et al. (2022) Algal-bacterial intervention as a management tool for next-generation aquaculture sustainability. JEB 43: 485-497.
- Langis R, Proulx D, de la Noüe J, Couture P (1988) Effects of a bacterial biofilm on intensive Daphnia culture. Aqua Eng 7: 21-38.
- Zhang B, Lin W, Wang YW Runlin Xu, Xu RX (2010) Effects of Artificial Substrates on Growth, Spatial Distribution and NonSpecific Immunity Factors of Litopenaeus vannamei in the Intensive Culture Condition. Turk J Fish Aquat Sci 10.
- Anand PSS, Kohli MPS, Roy SD, Sundaray JK, Kumar S, et al. (2015) Effect of dietary supplementation of periphyton on growth, immune response and metabolic enzyme activities in Penaeus monodon. Aquac Res 46: 2277-2288.
- Padmakumar KG (2009) Open Water Farming of Pearlspot Etroplus suratensis (Bloch) in Low-Volume Cages. AFS 22.
- Sugiura SH, Hardy RW (2000) Environmentally friendly feeds. In: Encyclopedia of Aquaculture. John Wiley and Sons New York 299-310.
- Keshava, Joseph PS, Joseph MM (1988) Feeding Habits of the Pearl-Spot Etrop/us suratensis (Bloch) in the Nethravati - Gurpur Estuary. In: The First Indian Fisheries Forum. Indian Branch Mangalore 203-206.
- Kumar A, Bhatnagar A, Garg SK (2009) Growth performance, carcass composition and digestive enzyme activity of pearlspot, Etroplus suratensis (Bloch) reared in inland saline groundwater ponds providing substrate or feed. Livestock Research for Rural Development 21: 11-15.
- Ranjeet K, Hameed PVPS (2015) Evaluation of Three Substrate Bound Periphyton Systems for the Farming of Oreochromis niloticus in South India. J of Fisheries and Aquatic Science 10: 276-285.
- Ramesh MR, Shankar KM, Mohan CV, Varghese TJ (1999) Comparison of three plant substrates for enhancing carp growth through bacterial biofilm. Aquacultural Engineering 19: 119-131.
- Shilta MT, Chadha NK, Pandey PK, Sawant PB (2016) Effect of biofilm on water quality and growth of Etroplus suratensis (Bloch, 1790). Aquacult Int 24: 661-674.
- Yadav SR, Chavan BR, Kumar Chadha N, et al. (2021) Effect of stocking density on growth performance, plankton abundance, body composition and haematological parameters of Etroplus suratensis (Bloch, 1790). Aquaculture Research 52: 4752-4766.
- APHA (2005) Standard Methods for the Examination of Water and Wastewater. American Public Health Association.
- Anwar H, Strap JL, Costerton JW (1992) Susceptibility of biofilm cells of Pseudomonas aeruginosa to bactericidal actions of whole blood and serum. FEMS Microbiology Letters 92: 235-242.
- Brown ME (1957) Experimental studies on growth. In: The Physiology of Fishes. Elsevier 361-400.
- Diatin I, Shafruddin D, Hude N, Sholihah M, Mutsmir I (2021) Production performance and financial feasibility analysis of farming catfish (Clarias gariepinus) utilizing water exchange system, aquaponic, and biofloc technology. Journal of the Saudi Society of Agricultural Sciences 20: 344-351.
- Bhandari SB (1989) Discounted Payback Period-Some Extensions. The Journal of Behavioral Science 21: 28-38.
- Kleinbaum DG, Kupper LL, Muller KE, Nizam A (1988) Applied Regression Analysis and Other Multivariable Methods.
- Harpaz S, Becker K, Blum R (1999) The effect of dietary L-carnitine supplementation on cold tolerance and growth of the ornamental cichlid fish Pelvicachromis pulcher-preliminary results. Journal of Thermal Biology 24: 57-62
- Chen S, Ling J, Blancheton JP (2006) Nitrification kinetics of biofilm as affected by water quality factors. Aquacultural Engineering 34: 179-197.
- Hora SL, Pillay TVR (1962) Handbook on fish culture in the Indo-Pacific region. Fisheries Division, Biology Branch, Food and Agriculture Organization of the United Nations, Rome.
- Emerenciano MGC, Martínez-Córdova LR, Martínez-Porchas M, Miranda-Baeza A (2017) Biofloc Technology (BFT): A Tool for Water Quality Management in Aquaculture. In: Tutu H (ed) Water Quality. InTech 92-109.
- Moriarty DJW (1997) The role of microorganisms in aquaculture ponds. Aquaculture 151: 333-349.
- Widanarni, Ekasari J, Maryam S (2012) Evaluation of Biofloc Technology Application on Water Quality and Production Performance of Red Tilapia Oreochromis sp. Cultured at Different Stocking Densities. HAYATI Journal of Biosciences 19: 73-80.
- Thompson FL, Abreu PC, Wasielesky W (2002) Importance of biofilm for water quality and nourishment in intensive shrimp culture. Aquaculture 203: 263-278.
- Avnimelech Y, Mokady S (1988) Protein biosynthesis in circulated ponds. In: Proceedings of the Second International Symposium on Tilapia in Aquaculture 301-309.
- Avnimelech Y, Mokady S, Schroeder GL (1989) Circulated Ponds As Efficient Bioreactors for Single Cell Protein Production. The lsraeli Journal of Aquacufture -Bamidgeh 41: 58-66.
- Avnimelech Y (1999) Carbon/nitrogen ratio as a control element in aquaculture systems. Aquaculture 176: 227-235.
- Hari B, Madhusoodana Kurup B, Varghese JT, SchramaJW, Verdegem MCJ (2004) Effects of carbohydrate addition on production in extensive shrimp culture systems. Aquaculture 241: 179-194.
- Pedersen L-F, Suhr KI, Dalsgaard J, Pedersen PB, Arvin E (2012) Effects of feed loading on nitrogen balances and fish performance in replicated recirculating aquaculture systems. Aquaculture 338-341: 237-245.
- Boyd CE, Clay J (2002) Evaluation of Belize Aquaculture, Ltd: A Super-intensive Shrimp Aquaculture System. Review report prepared under the World Bank, NACA, WWF and FAO Consortium Program on Shrimp Farming and the Environment.
- Dillon PJ (1975) The phosphorus budget of Cameron Lake, Ontario: The importance of flushing rate to the degree of eutrophy of lakes1: Phosphorus budgets and flushing rates. Limnol Oceanogr 20: 28-39.
- Bbalali S, Hoseini SA, Ghorbani R, Kordi H (2013) Relationships between Nutrients and Chlorophyll a Concentration in the International Alma Gol Wetland, Iran. J Aquac Res Development 04: 173.
- Asaduzzaman M (2012) C/N-controlled periphyton-based freshwater prawn farming system: A sustainable approach to increase pond productivity.
- Steinman AD, Lamberti GA, Leavitt PR (2007) Biomass and Pigments of Benthic Algae. In: Methods in Stream Ecology 357-379.
- Keshavanath P, Gangadhar B, Ramesh TJ, van Dam AA, Beveridge MCM, et al. (2002) The effect of periphyton and supplemental feeding on the production of the indigenous carps Tor khudree and Labeo fimbriatus. Aquaculture 213: 207-218.
- Gogoi K, Sarma DK, Baishya S, Bhagawati K, Tamuli KK (2018) Quantitative and qualitative analysis of periphyton composition in carp polyculture system. Journal of Entomology and Zoology Studies 6: 519-526.
- Azim ME, Verdegem MCJ, Rahman MM, Wahab MA, van Dam AA, et al. (2002) Evaluation of polyculture of Indian major carps in periphyton-based ponds. Aquaculture 213: 131-149.
- Uddin MS, Rahman SMS, Azim ME, Wahab MA, Verdegem MCJ, et al. (2007) Effects of stocking density on production and economics of Nile tilapia (Oreochromis niloticus) and freshwater prawn (Macrobrachium rosenbergii) polyculture in periphyton-based systems: Optimal stocking density of Nile tilapia and prawn in polyculture. Aquaculture Research 38: 1759-1769.
- Azim ME, Wahab MA, van Dam AA, Beveridge MCM, Milstein A, et al. (2001) Optimization of fertilization rate for maximizing periphyton production on arti®cial substrates and the implications for periphyton-based aquaculture. Aquaculture Research 32: 749-760.
- Lyons MM, Ward JE, Gaff H, Hicks RE, Drake J, et al. (2010) Theory of island biogeography on a microscopic scale: organic aggregates as islands for aquatic pathogens. Aquat Microb Ecol 60: 1-13.
- Kiørboe T, Tang K, Grossart H-P, Ploug H (2003) Dynamics of Microbial Communities on Marine Snow Aggregates: Colonization, Growth, Detachment, and Grazing Mortality of Attached Bacteria. Appl Environ Microbiol 69: 3036-3047.
- Hargreaves JA (2013) Biofloc Production Systems for Aquaculture. SRAC Publication 4503:1-11.
- Avnimelech Y (2014) Biofloc Technology – A Practical Guide Book, 3rd Edn. Baton Rouge. World Aquaculture Society.
- Sukumaran K, Thirunavukkarasu AR, Kailasam M, Sundaray JK, Biswas G, et al. (2017) Evaluation of Bamboo, Coconut Shell Substrates and Supplemental Feeding on the Growth of Pearlspot, Etroplus Suratensis (Bloch) Fry in Low Volume Cages. Fishery Technology 54: 1-7.
- Jana SN, Garg SK, Patra BC (2004) Effect of periphyton on growth performance of grey mullet, Mugil cephalus (Linn.), in inland saline groundwater ponds. J Appl Ichthyol 20: 110-117.
- Jana SN, Garg SK, Thirunavukkarasu AR, Bhatnagar A, Kalla A, et al. (2006) Use of Additional Substrate to Enhance Growth Performance of Milkfish, Chanos chanos (Forsskal) in Inland Saline Groundwater Ponds. Journal of Applied Aquaculture 18: 1-20.
- Uddin MS (2007) Mixed culture of tilapia (Oreochromis niloticus) and freshwater prawn (Macrobrachium rosenbergii) in periphyton-based ponds.
- Moss KRK, Moss SM (2004) Effects of Artificial Substrate and Stocking Density on the Nursery Production of Pacific White Shrimp Litopenaeus vannamei. J World Aquaculture Soc 35: 536-542.
- Bratvold D, Browdy CL Effects of sand, sediment, vertical surfaces on intensive shrimp production. Global Aquaculture Advocate 1-10
- Lara G, Honda M, Poersch L, Wasielesky W (2017) The use of biofilm and different feeding rates in biofloc culture system: the effects in shrimp growth parameters. Aquacult Int 25: 1959-1970.
- Emerenciano M, Ballester ELC, Cavalli RO, Wasielesky W (2012) Biofloc technology application as a food source in a limited water exchange nursery system for pink shrimp Farfantepenaeus brasiliensis (Latreille, 1817): BFT as a food source for F brasiliensis. Aquac Research 43: 447-457.
- Viau VE, de Souza DM, Rodríguez EM, et al. (2013) Biofilm feeding by postlarvae of the pink shrimp Farfantepenaeus brasiliensis (Decapoda, Penaidae). Aquac Res 44: 783-794.
- Kumlu M, Eroldogan OT, Saglamtimur B (2001) The effects of salinity and added substrates on growth and survival of Metapenaeus monoceros žDecapoda: Penaeidae/ post-larvae. Aquac 196: 177-188.
- Tidwell JH, Coyle S, Arnum A, Weibel C (2000) Production Response of Freshwater Prawns Macrobrachium rosenbergii to Increasing Amounts of Artificial Substrate in Ponds. J of the World Aquac Society 31: 452-458.
- Tidwell JH, Coyle SD, Arnum A, Weibel C (2002) Effects of Substrate Amount and Orientation on Production and Population Structure of Freshwater Prawns Macrobrachium rosenbergii in Ponds. J World Aquac Soc 33: 63-69.
- Van Dam AA, Beveridge MCM, Azim ME, Verdegem MCJ (2002) The potential of fish production based on periphyton. Reviews in Fish Biology and Fisheries 12: 1-31.
- Milstein A, Azim ME, Abdul Wahab M, Verdegem MCJ (2003) The Effects of Periphyton, Fish and Fertilizer Dose on Biological Processes Affecting Water Quality in Earthen Fish Ponds. Environmental Biology of Fishes 68: 247-260.
- Panjaita P (2004) Field and laboratory study of Penaeus monodon culture with zero water exchange and limited water exchange model using molasses as a carbon source.
- Burford MA, Sellars MJ, Arnold SJ, Keys SJ, Crocos PJ, et al. (2004) Contribution of the natural biota associated with substrates to the nutritional requirements of the post-larval shrimp, Penaeus esculentus (Haswell), inhigh-density rearing systems. Aquac Research 35: 508-515.
- Avnimelech Y, Kochva M, Diab S (1994) Development of controlled intensive aquaculture systems with a limited water exchange and adjusted carbon to nitrogen ratio. The Israeli J of aquac Bamidgeh 46: 119-131.
- Audelo Naranjo JM, Voltolina D, Romero Beltran E (2012) Culture of white shrimp (Litopenaeus vannamei Boone, 1931) with zero water exchange and no food addition: an eco-friendly approach. lajar 40: 441-447.
- Voltolina D, Audelo-Naranjo JM, Romero E (2013) Promotion of periphyton for white shrimp culture: towards an ecological aquaculture. Boletim do Instituto de Pesca 39: 179-186.
- Becerra-Dórame MJ, Martínez-Porchas M, Martínez-Córdova LR, Rivas-Vega ME, López-Elías JA, et al. (2012) Production Response and Digestive Enzymatic Activity of the Pacific White Shrimp Litopenaeus vannamei (Boone, 1931) Intensively Pregrown in Microbial Heterotrophic and Autotrophic-Based Systems. The Scientific World Journal 2012: 1-6.
- Rai S, Yi Y, Wahab MA, Rivas-Vega ME, López-Elías JA, et al. (2008) Comparison of rice straw and bamboo stick substrates in periphyton-based carp polyculture systems. Aquaculture Res 39: 464-473.
- Milstein A, Joseph D, Peretz Y, Harpaz S (2005) Evaluation of organic tilapia culture in periphyton-based ponds. Israeli J of Aquaculture - Bamidgeh 57: 143-155.
Citation: Yadav SR, Chavan BR, Chadha NK, Naik SD, Krishnani KK, et al. (2023) Effect of Supplementary Feeding On Culture Performance of Etroplus suratensis (Bloch. 1790) In a Biofilm-Based Rearing System. J Aquac Fisheries 7: 59.
Copyright: © 2023 Yadav SR, et al. This is an open-access article distributed under the terms of the Creative Commons Attribution License, which permits unrestricted use, distribution, and reproduction in any medium, provided the original author and source are credited.