Facility Characteristics Associated with Medicare-Covered Skilled Nursing Facility Lengths of Stay
*Corresponding Author(s):
Colleen KummetFederal Health Division, General Dynamics Information Technology (GDIT), 1401 50th St West Des Moines, IA 50266, United States
Tel:+1 5158028953,
Email:colleen.kummet@gdit.com
Abstract
The objective of this study was to identify facility-level predictors of Skilled Nursing Facility (SNF) Lengths of Stay (LOS). This study employed U.S. Medicare fee-for-service claims and enrollment for 2014-2015, and 2014 Nursing Home (NH) compare data to examine SNF LOS in Medicare beneficiaries. After covariate adjustment, we found that for-profit status and higher levels of registered nurse staffing and staffing were significantly associated with shorter SNF LOS. Facility ratings, such as higher overall NH Compare star ratings and higher levels of RN staffing, were associated with shorter LOS on average, a finding that has implications for future policy decisions and the potential to shorten SNF LOS without a reduction in quality.
Introduction
In 2017, the U.S. Medicare program spent $28.4 billion on the Skilled Nursing Facility (SNF) benefit. Medicare Fee-For-Service (FFS) per-capita spending on SNF services increased by 43% from 2005-2017 [1]. For several years, MedPAC and others have raised concerns over Medicare SNF spending [1]. Average SNF Lengths of Stay (LOS) vary widely across geographic areas and providers; however, there is limited understanding of the sources of such variation. The highest Medicare profit margin quartile for SNFs in 2017 serve higher percentages of dually eligible beneficiaries and minorities and have 21% longer average LOS when compared to the SNFs in the lowest margin quartile [1]. These findings raise questions as to whether facility-level characteristics may be driving longer average SNF LOS for facilities.
Evidence from the Centers for Medicare & Medicaid Services (CMS) Center for Medicare and Medicaid Innovation (Innovation Center) payment model evaluations suggests the potential for safely reducing SNF LOS and resulting Medicare program savings. For example, the CMS Innovation Center Bundled Payments for Care Improvement (BPCI) initiative found a statistically significant reduction in Medicare payments for lower extremity joint replacement for participating providers primarily due to reduced use of institutional Post-Acute Care (PAC), including SNF services, with no evidence of a reduction in measures of quality. The reduction in the cost of SNF services observed in the BPCI initiative was a result of both fewer patients discharged to SNF and shorter average LOS for those patients who were discharged to a SNF [2]. Studies of Accountable Care Organization (ACO) quality over time have found that ACO participants had reduced utilization of PAC and shorter length of SNF stays [3], demonstrating the potential for SNFs to shorten LOS, thereby reducing Medicare costs, without compromising patient quality of care. Average SNF LOS vary widely across geographic areas and providers, however, there is limited understanding of the sources of such variation. Previous studies [4,5] have found an increased risk of readmission or death for lower SNF performance ratings. These findings indicate that some provider level characteristics may be driving poorer outcomes for beneficiaries within certain facilities. The purpose of this study was to identify facility-level predictors of skilled nursing facility LOS to inform policy and initiatives to control the costs while improving the quality of SNF care for Medicare beneficiaries.
Methods
Data sources included U.S. nationwide 2014-2015 Medicare enrollment data files and Medicare Fee-For-Service (FFS) claims, obtained from the CMS Chronic Conditions Data Warehouse (CCW). Data sources for SNF provider characteristics included the 2014 Provider of Service (POS) file [6] and 2014 Nursing Home (NH) Compare [7], both of which are publicly available. The study population included Medicare beneficiaries (both dually eligible and Medicare-only) who were aged 65 years or older with a Medicare covered SNF stay in 2014. The study year of 2014 was chosen because it was the most recent year of final claims and assessment data when the study was initially designed. The study population required enrollment in Medicare FFS Parts A and B, and excluded individuals enrolled in Medicare Advantage plans. If a beneficiary had more than one SNF stay during 2014, we chose a stay at random to be included in the analysis for that beneficiary. Length of Medicare covered SNF stay in days was the primary outcome of interest; in other words, the total number of Medicare covered days from the SNF claims for that stay. We defined a SNF stay as contiguous Part A SNF claims with uninterrupted dates of service for a beneficiary at a single facility. The covered days are the days paid for by the Medicare Part A benefit.
We extracted facility-level data from POS files for SNFs including information on facility size, rural/urban location, and other attributes. We selected facility attributes based on significant factors in previous SNF LOS literature, a priori knowledge, and availability in secondary claims and assessment data. We linked facility-level ratings from 2014 NH Compare data by provider number to add information about ownership, overall, as well as by staffing, RN staffing, quality, and survey ratings. Nursing home five-star quality ratings on NH Compare range from 1-5 stars. Nursing homes with 5 stars are considered to have much above average quality and nursing homes with 1 star are considered to have quality much below average. There is one Overall 5-star rating for each nursing home, and separate ratings for health inspections, staffing and quality measures [8]. The nursing home staffing domain star rating for staffing hours reflects the ratio of staff to residents in comparison to other freestanding Medicare and Medicaid certified nursing homes across the nation. A nursing home’s rating for overall staffing is based on the combination of Registered Nurse (RN) hours per resident per day, Licensed Practical Nurses/Licensed Vocational nurse hours per resident per day, and nurse aide hours per resident per day.
The Five-Star Quality Rating System for nursing home quality measures domain ratings use clinical information to measure quality of patient care, such as vaccinations, pain management and falls. Survey star ratings are based on state survey agencies health and safety annual and complaint inspections of nursing facilities and SNFs including food safety, emergency preparedness and fire safety. We calculated case-mix at the provider level by averaging the Resource Utilization Group (RUG) weights for each SNF admission during the study period [9]. We averaged Hierarchical Condition Category (HCC) scores for beneficiaries served by the facility and the proportion of beneficiaries with a disability (defined by the Original Reason for Medicare Coverage (OREC)) and we calculated the proportion of beneficiaries dually eligible (either full or partial eligibility[i]) to characterize the facility’s patient population. We excluded providers with 30 or fewer SNF stays in the study period from the analysis to prevent high variability resulting from sparse data from affecting model performance.
We used a multivariable linear Ordinary Least Squares (OLS) model to predict average SNF LOS at the provider level. Model fitting began with the selection of a base model that included all identified variables with a significant bivariate t-test when compared to SNF LOS, or that we believed could theoretically impact SNF LOS at the provider level. We assessed model performance using the R2 statistic and model fit through the examination of Pearson residuals. We examined the covariates for multicollinearity, chose the final model based on balance model fit and parsimony, and examined first-order interactions among effects. We used SAS Enterprise Guide 7.1 for all analyses and assumed a type I error of alpha=0.05.
[i]Dually eligible individuals are enrolled in Medicare Part A and/or Part B, and are also enrolled in Medicaid benefits and/or the Medicare Savings Programs (MSPs) administered by each individual state. The dual-eligible population can be divided into “full duals” and “partial duals” on the basis of eligibility for Medicaid benefits. At a minimum, all dual-eligible beneficiaries qualify to have the Medicaid program pay their premiums for Part B of Medicare (partial duals). Full duals qualify for all Medicaid benefits including coverage of various Medicaid-covered health care services that Medicare does not cover.
Results
This study analyzed stays from 9,418 SNFs. We examined several provider-level characteristics including ownership type, rural/urban location, and NH Compare quality ratings. Non-profit SNF providers comprised 24% of facilities and had the lowest average SNF LOS at 28.1 days (Table 1). There were only 343 government facilities in the study and the average stay for these providers was 31.5 days. Most providers were for-profit facilities, and this group averaged the longest stays at 32.9 covered days per stay.
|
Characteristics |
SNF LOS (in days) |
|||||
|
|
N |
Percent |
Mean |
St Dev |
Median |
p-value |
|
Total Providers |
9,418 |
100.0% |
29.4 |
22.3 |
31 |
|
|
Ownership Type |
||||||
|
For Profit |
6,811 |
72.3% |
32.9 |
7.9 |
32 |
<0.0001 |
|
Government |
343 |
3.6% |
31.5 |
10.1 |
32 |
|
|
Non Profit |
2,264 |
24.0% |
28.1 |
8.1 |
28 |
|
|
Location |
||||||
|
Rural |
2,239 |
23.8% |
33.3 |
8.6 |
33 |
<0.0001 |
|
Urban |
7,179 |
76.2% |
31.2 |
8.2 |
31 |
|
|
Nursing Home Compare |
1 Star |
2 Star |
3 Star |
4 Star |
5 Star |
|
|
Overall |
N |
750 |
1,855 |
1,606 |
2,480 |
2,727 |
|
Percent |
8.0% |
19.7% |
17.0% |
26.3% |
29.0% |
|
|
Mean LOS* |
34.6 |
32.8 |
32.6 |
31.3 |
30.0 |
|
|
Quality |
N |
142 |
428 |
1,217 |
3,281 |
4,350 |
|
Percent |
1.5% |
4.5% |
12.9% |
34.8% |
46.2% |
|
|
Mean LOS |
29.2 |
31.4 |
31.1 |
31.9 |
31.9 |
|
|
RN Staffing |
N |
747 |
1,440 |
2,552 |
2,612 |
2,067 |
|
Percent |
7.9% |
15.3% |
27.1% |
27.7% |
22.0% |
|
|
Mean LOS* |
35.9 |
34.2 |
32.9 |
31.4 |
27.3 |
|
|
Staffing |
N |
898 |
1,303 |
1,928 |
4,247 |
1,042 |
|
Percent |
9.5% |
13.8% |
20.5% |
45.1% |
11.1% |
|
|
Mean LOS* |
36.2 |
34.2 |
33.0 |
31.0 |
25.2 |
|
|
Survey |
N |
1,785 |
2,200 |
2,225 |
2,223 |
985 |
|
Percent |
19.0% |
23.4% |
23.6% |
23.6% |
10.4% |
|
|
Mean LOS* |
32.8 |
32.3 |
31.9 |
30.8 |
29.8 |
|
Table 1: Categorical characteristics of SNF facilities and bivariate results.
Source/Notes: SOURCE Medicare FFS Claims, Nursing Home Compare, and Provider of Service Files NOTES * Mean LOS was significantly different across star ratings.
Over three-fourths of facilities were located in an urban area and the average number of Medicare covered days was 31.2 days. Rural facilities averaged longer stays at 33.3 days. Average lengths of Medicare covered stays differed by overall, RN staffing, staffing and survey ratings (p < 0.05). In these cases, we observed a dose response in that as ratings increased, average LOS decreased. This pattern was strongest for the item that measured RN staffing. We found that the highest rated facilities for RN staffing had average LOS that were at least seven days shorter than the average LOS at facilities that scored the lowest on staffing (Table 1 and Figure 1).
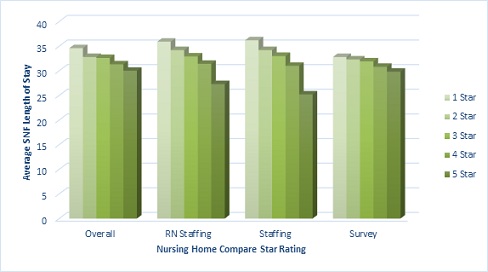 Figure 1: Mean skilled nursing facility covered stay days by nursing home compare 2014 ratings.
Source/Notes: SOURCE Medicare FFS Claims, Nursing Home Compare
We used a multivariable OLS model to estimate provider-level average (mean) length of skilled nursing covered stay. Model covariates included quartiles of disability rate and tertiles of dual eligibility rate and average age of beneficiaries for that provider, the average (mean) HCC score at entry, and the SNF’s NH Compare staffing and RN staffing ratings, rural/urban location, the average (mean) RUG weight and the SNF’s for-profit status. Also considered for model inclusion were percent female, percent White race, NH Compare quality, overall, and survey ratings, and bed count. None of these were significant in the final model. Table 2 below shows the estimates of each of the factors remaining in the final model that were statistically significant.
|
Parameter |
Estimate |
SE |
95% LCL |
95% UCL |
P Value |
|
Intercept |
13.32 |
0.80 |
12.52 |
14.12 |
<0.0001 |
|
Average Age Category in Years (<80, 80-82, >82) |
4.05 |
0.26 |
3.79 |
4.31 |
<0.0001 |
|
Dual Eligibility Rate Category (<23%, 23-40%, >40%) |
4.90 |
0.28 |
4.62 |
5.18 |
<0.0001 |
|
Average Age and Dual Eligibility Rate Category Interaction |
-1.15 |
0.12 |
-1.27 |
-1.03 |
<0.0001 |
|
NH Compare Staffing Rating (1-5) |
-0.72 |
0.10 |
-0.82 |
-0.62 |
<0.0001 |
|
NH Compare RN Staffing Rating (1-5) |
-0.58 |
0.09 |
-0.67 |
-0.49 |
<0.0001 |
|
Disability Rate Category (OREC) (<11%, 11-16%, 16-22%, >22%) |
0.44 |
0.09 |
0.35 |
0.53 |
<0.0001 |
|
Average HCC Score at Entry |
1.37 |
0.18 |
1.19 |
1.55 |
<0.0001 |
|
For Profit Status (vs. non-profit, government, and other) |
1.62 |
0.18 |
1.44 |
1.80 |
<0.0001 |
|
Rural vs Urban |
2.00 |
0.18 |
1.82 |
2.18 |
<0.0001 |
|
Average RUG Weight Category ( <1.3, 1.3-1.4, >1.4) |
1.72 |
0.10 |
1.62 |
1.82 |
<0.0001 |
Table 2: OLS estimates from multivariable linear model to identify facility-level factors associated with SNF lengths of stay.
Source/Notes: SOURCE Medicare FFS Claims, Nursing Home Compare, and Provider of Service Files
Note: LCL=Lower Confidence Limit, UCL=Upper Confidence Limit, R2=0.47
We adjusted the model for facility case-mix indicators, such as patient HCC score, age and RUG weights, percent of population with a disability or dually eligible. After adjusting for facility case-mix indicators, staffing, ownership and rural/urban status were significantly associated with LOS. An increase of RN staffing or staffing rating was related to a decrease in average LOS. A one star increase in RN staffing rating was associated with a decrease in LOS of 0.58 days on average, whereas a one star increase in staffing rating was associated with a decrease of 0.72 days on average. For-profit ownership was predictive of a 1.6 day increase in average LOS compared to non-profit and government owned facilities. Rural location of the facility was significantly associated with an increase of 2 days to the SNF LOS on average (Table 2).
Facilities serving a higher percentage of beneficiaries with a disability were significantly associated with longer average LOS. Higher average HCC and RUG weights were also associated with increased stays on average. The effect of age on SNF LOS was more pronounced for facilities serving a lower percentage of dually eligible beneficiaries. For example, in facilities serving the lowest percentage of dually eligible beneficiaries (< 23%), an increase in average age of beneficiaries from < 80 years to 80-82 years is associated with an increase of 2.9 day on average holding all other covariates constant. In contrast, for facilities serving the highest percentage of dually eligible beneficiaries (> 40%) the effect of an increase in average age from
Discussion
An important result of our study was that a higher rating of RN staffing was a significant factor associated with shorter SNF LOS, agreeing with previous studies that documented higher availability of nursing staff as a benchmark for higher quality in nursing facilities [10-12]. CMS requires facilities that receive Medicaid and Medicare payments to provide sufficient licensed nursing services 24 hours a day, including an RN for at least 8 consecutive hours every day. CMS has recognized that staffing in nursing homes has a substantial impact on the quality of care and outcomes residents experience. For more than ten years, CMS has been posting information on facility staffing measures on the Medicare.gov website Nursing Home Compare (now known as Care Compare), including the average number of hours worked reported for nursing staff, per resident per day. In February, 2022, the President announced reforms to establish a minimum nursing home staffing requirement ensuring safe and quality care to patients and adequate support to staff [13]. In April 2022, CMS issued its fiscal year 2023 SNF Prospective Payment System proposed rule, which includes a request for public feedback on how staffing in nursing homes and health equity improvements could lead to better health outcomes. One of the proposed new measures, Total Nursing Hours per Resident Day, is a structural measure that uses auditable electronic data to calculate total nursing hours per resident each day with the goal of helping providers to improve the quality of care and services they deliver to residents [14].
The NH Compare quality domain rating is a broad composite measure based on indicators such as antipsychotic administration, pain management and improvement of activities of daily living and pressure ulcers among others. We did not find a significant relationship with the broad quality rating and SNF LOS in the multivariable model. One reason is that the quality domain includes metrics that may shorten LOS such as hospitalization resulting in shorter LOS for lower performing facilities. The relationship of facility quality rating and SNF LOS may be more complex and warrants further study.
Our findings corroborate previous studies that have documented the disparities in characteristics of SNF stays by dual-eligibility status, such as keeping dually eligible beneficiaries in facilities longer and converting them to long-stay custodial patients at higher rates than non-dually eligible beneficiaries [15]. Our study was unique in finding evidence of an interaction of the percentage of dually eligible beneficiaries that a facility serves and the average age of the beneficiaries. We observed that the effect of age on SNF LOS was more pronounced for facilities serving a lower percentage of dually eligible beneficiaries.
Strengths of this study include the linkage and utilization of large, national, population-based data that incorporates administrative claims and facility-level data. The design utilized multivariable adjustment for patient heterogeneity among SNFs in order to determine the factors most associated with the number of SNF covered days. Study limitations include the use of billing and administrative data for research purposes. Since our population was comprised of only the Medicare FFS population, Medicare Advantage (HMO) beneficiaries, who may differ in their patterns of SNF use, were not included in this study. We were also limited in terms of the administrative data available regarding nursing home factors that could impact the LOS. With over 9,000 facilities included in the analysis - it is possible that local health care market factors, which are beyond the scope of this study, may have an effect on LOS.
Finally, we note that the CMS case mix classification under the SNF Patient-Driven Payment Model (PDPM), which is effective as of Federal Fiscal Year (FFY) 2020, relies less on beneficiary characteristics that may change very frequently over the course of a resident's stay [16]. Characteristics such as therapy minutes can vary due to resident refusal or unexpected changes in resident status. The new case mix classification under PDPM relies on more stable predictors of resource utilization by tying case mix classification to resident characteristics such as diagnosis information. It is unclear how this change may affect SNF LOS, but warrants further study.
Conclusion
After controlling for facility case-mix, patient demographics, and other factors, we found rural and for-profit status, and percent of dually eligible beneficiaries to be associated with longer average lengths of Medicare covered SNF stays. Findings from this study will inform CMS and policymakers which facility types should be the focus of outreach, guidance, or policy initiatives to ensure value in skilled nursing care for Medicare beneficiaries. Facility performance measures, such as higher NH Compare star ratings and increasing levels of RN staffing and staffing had lower LOS on average, a finding that has implications for future policy decisions and the potential to shorten SNF LOS without a reduction in quality.
Conflicts of Interest
The Authors declare that there is no conflict of interest.
Funding
This work was funded by the Centers for Medicare & Medicaid Services Chronic Conditions Data Warehouse (CCW) Contract.
References
- Medicare Payment Advisory Commission (MedPAC) (2019) March 2019 Report to the Congress: Medicare Payment Policy. MedPAC, Washington, DC, USA.
- Dummit LA, Kahvecioglu D, Marrufo G, Rajkumar R, Marshall J, et al. (2016) Association between hospital participation in a Medicare bundled payment initiative and payments and quality outcomes for lower extremity joint replacement episodes. JAMA 316: 1267-1278.
- McWilliams JM, Gilstrap LG, Stevenson DG, Chernew ME, Huskamp HA, et al. (2017) Changes in postacute care in the Medicare Shared Savings Program. JAMA Intern Med 177: 518-526.
- Neuman MD, Wirtalla C, Werner RM (2014) Association between skilled nursing facility quality indicators and hospital readmissions. JAMA 312: 1542-1551.
- Kimball CC, Nichols CI, Nunley RM, Vose JG, Stambough JB (2018) Skilled nursing facility star rating, patient outcomes, and readmission risk after total joint arthroplasty. J Arthroplasty 33: 3130-3137.
- Centers for Medicare & Medicaid Services (CMS) (2014) Provider of Services Current Files. CMS, Missouri, USA.
- Centers for Medicare & Medicaid Services (CMS) (2014) Nursing homes including rehab services data archive. CMS, Missouri, USA.
- Centers for Medicare & Medicaid Services (CMS) (2022) Five-Star Quality Rating System. CMS, Missouri, USA.
- Centers for Medicare & Medicaid Services (CMS) (2014) Medicare Program; Prospective Payment System and Consolidated Billing for Skilled Nursing Facilities for FY 2014. CMS, Missouri, USA.
- Castle NG (2008) Nursing home caregiver staffing levels and quality of care: A literature review. Journal of Applied Gerontology 27: 375-405.
- Castle NG, Anderson RA (2011) Caregiver staffing in nursing homes and their influence on quality of care: Using dynamic panel estimation methods. Med Care 49: 545-552.
- Harrington C, Zimmerman D, Karon SL, Robinson J, Beutel P (2000) Nursing home staffing and its relationship to deficiencies. The Journals of Gerontology Series B: Psychological Sciences and Social Sciences 55: 278-287.
- The White House (2022) FACT SHEET: Protecting Seniors by Improving Safety and Quality of Care in the Nation’s Nursing Homes. The White House, Washington, DC, USA.
- Centers for Medicare & Medicaid Services (CMS) (2022) HHS Takes Actions to Promote Safety and Quality in Nursing Homes. CMS, Missouri, USA.
- Rahman M, Gozalo P, Tyler D, Grabowski DC, Trivedi A, et al. (2014) Dual eligibility, selection of skilled nursing facility, and length of Medicare paid postacute stay. Med Care Res Rev 71: 384-401.
- Centers for Medicare & Medicaid Services (CMS) (2019) Fiscal Year 2020 Payment and Policy changes for Medicare Skilled Nursing Facilities (CMS-1718-F). CMS, Missouri, USA.
Citation: Kummet C, Schneider K, Wang C, Longinaker N, Joseph-King M, et al. (2022) Facility Characteristics Associated with Medicare-Covered Skilled Nursing Facility Lengths of Stay. J Gerontol Geriatr Med 8: 136.
Copyright: © 2022 Colleen Kummet, et al. This is an open-access article distributed under the terms of the Creative Commons Attribution License, which permits unrestricted use, distribution, and reproduction in any medium, provided the original author and source are credited.