Growth in Early Childhood of Children Who are Born Prematurely and Exclusively Fed with Expressed Breast Milk in the Neonatal Period
*Corresponding Author(s):
Bandara SNeonatal Intensive Care Unit (NICU), Teaching Hospital Peradeniya, Sri Lanka
Email:msskbandara@yahoo.com
Abstract
The critical period for the growth and the neurodevelopment of a premature infant is the first few weeks of life. The nutritional requirement goes to its highest point during this period and the nutrition should be optimized to baby's needs. We tried to find out whether the exclusive breast feeding is adequate to nourish a neonate during first few weeks of its life by assessing their heights by the age of 2-5 years.
We tested fifty children aged 2-5 years who were born prematurely within POA of 26-34 weeks and were exclusively been fed with breast milk during their neonatal period. Data were collected from the clinic records and were analyzed by Descriptive analysis and contingency tables. 74% of the sample achieved the predicted mid parental height by that age, according to the cluster analysis.
So we can conclude that the exclusive breast feeding during the neonatal period is adequate for premature babies to achieve their predicted mid parental heights by the age of 2-5 years.
Keywords
Exclusive breast feeding; Expressed breast milk; Mid-parental height; Premature babies
Abbreviations
NICU: Neonatal Intensive Care Unit
OFC: Occipito-Frontal Circumference
POA: Period of Amenorrhea
Introduction
The first weeks of life are a critical stage for the growth and neurodevelopment of a Very Low Birth Weight (VLBW) infant [1]. This is the phase in which the nutritional requirements for an adequate growth are greater than at any other time in life. The consequences of insufficient nutrition in this critical period have yet to be determined with certainty, but there is considerable evidence that early growth failure has long-term negative effects on childhood growth including height and OFC, and that these effects probably persist into adulthood [2].
The Committee on Nutrition of the American Academy of Pediatrics has recommended a caloric intake of 120 kcal/kg/day for children enterally fed and 80 to 100 kcal/kg/day for those parentally fed, with a protein intake of 3.5 to 4 g/kg/day [3]. However, it is difficult for most VLBW infants to reach this suggested caloric and protein intake in the first two months of age [3].
According to studies done in the western world some time ago showed unfortified EBM will not meet the nutritional needs of infants <1500g [3]. According to them the nutritional needs of premature infants are usually dependent upon parenteral nutrition during early postnatal life, especially for Very Low Birth Weight (VLBW) infants. But by present the trend has changed. A study done by Xiao-Ming ben in 2008 has shown that the first choice of nutrition for premature babies is the own mother's breast milk [4]. A meta-analysis done by Dominica AGidrewicz in 2014 showed that premature breast milk contains higher energy, proteins and fat compared to term breast milk [5].
However in developing countries early parenteral nutrition cannot be provided due to economic constrains. Thus we start them on breast milk early, within the first two days. In our follow up clinics we have observed that most had a satisfactory growth. Thus we decided to evaluate their height in early childhood.
Objective
The proportion of children who had their height in the range of the mid parental height by the age of 2-5 yrs.
Literature Review
Annals of Ibaden, a post graduate medicine journal recommend that interventions like early commencement of minimal enteral feeds and preference for human breast milk should be practiced optimally. It also emphasizes on both clinical practice as well as research, to reduce nutritional deficits in this vulnerable infants [6].
According to the mea-analysis conducted by Dominica AGidrewicz and Tanis R Fenton in August 2014, preterm breast milk is higher in energy and most of the nutrients than those of term breast milk [5]. They have proved this by analyzing 41 previous studies. Graphs drawn by them are as follows (Figures 1 and 2).
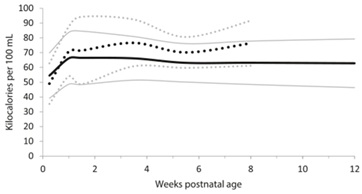
Figure 1: Measured energy distribution of preterm and term breast milk by postnatal age over the first 12 weeks of lactation, weighted mean and 95% reference interval. Preterm milk … Team milk -- : mean + / - 2 standard deviations.
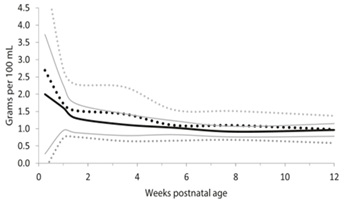 Figure 2: True Protein content distribution of preterm and term breast milk in by postnatal age over the first 12 weeks of lactation, weighted mean and 95% reference interval. Preterm milk … team milk --: mean + / - 2 standard deviations.
By this analysis we can understand that preterm breast milk provides adequate nutrition to the preterm baby, certifying its satisfactory growth.
According to research performed in United Kingdom poor weight gain observed in preterm infants who were fed expressed breast milk compared with those fed a cows' milk formula prompted a detailed study of early postnatal growth in preterm infants fed these two milks. 68 infants were divided into two categories by gestational age at birth (i) 28-32 weeks (n=28), (ii) 33-36 weeks (n=40). They were randomly allocated to a feed of expressed breast milk or a milk formula (Ostermilk 1). Rates of weight gain, linear growth, and head circumference growth were evaluated over two periods: birth-1 month, 1-2 months. The younger group who were fed breast milk showed slower overall growth rates over the first month than those fed formula. In the second month, and for the older infants over both of the 2-monthly periods, growth rates were similar in the two feeding regimens. It is concluded that expressed breast milk is inadequate for the growth of very immature preterm infants during early postnatal life [7].
A retrospective single-center observational study performed on 206 very preterm infants aimed to investigate the impact of the cumulative intake of fortified human milk on early postnatal growth in a cohort of very low birth weight infants after early transition to full enteral feeds. Full enteral feeds were established at postnatal day 8 (6-10) and adequate postnatal growth was achieved (difference in standard deviation score for weight from birth to discharge -0.105(-0.603 - -0.323)). Standard deviation score for weight from birth to day 28 decreased more in infants with a cumulative human milk intake >75% of all enteral feeds (-0.64(-1.08 - -0.34)) compared to those with <25% human milk intake (-0.41(-0.7 - -0.17); p = 0.017). At discharge, a trend towards poorer weight gain with higher proportions of human milk intake persisted. In contrast, no significant difference was observed for head circumference growth. The conclusion was standardized fortification of human milk may not adequately support early postnatal growth [8].
A systematic review of randomized controlled trials and observational studies was performed in America to determine whether earlier administration of Parenteral Nutrition benefits growth outcomes in preterm infants. Eight Randomizes Control Trials and 13 observational studies met the inclusion criteria (n = 553 and 1796 infants). The meta-analysis was limited by disparate growth-outcome measures. An assessment of bias was difficult because of inadequate reporting. Results are given as mean differences (95% CIs). Early Parenteral Nutrition reduced the time to regain birth weight by 2.2 d (1.1, 3.2 d) for Randomizes Control Trials and 3.2 d (2.0, 4.4 d) in observational studies. The maximum percentage weight loss with early Parenteral Nutrition was lower by 3.1 percentage points (1.7, 4.5 percentage points) for Randomizes Control Trials and by 3.5 percentage points (2.6, 4.3 percentage points) for observational studies. Early PN improved weight at discharge or 36 wk postmenstrual age by 14.9 g (5.3, 24.5 g) (observational studies only), but no benefit was shown for length or head circumference. There was no evidence that early Parenteral Nutrition significantly affects risk of mortality. Conclusions were that early Parenteral Nutrition provides a benefit for some short-term growth outcomes. No evidence that early Parenteral Nutrition increases morbidity or mortality was found [9].
In Indiana a study cohort consisted of 84 premature infants born at less than 30 weeks gestation to test the hypothesis that premature infants would grow adequately when they received more than 50 kcal/kg per day of parenteral nutrition. A computer software program was used to determine parenteral nutrition orders and establish a database. The database provided the nutrition and postnatal growth data. Successful growth was defined as weight greater than the 10th percentile for intrauterine growth. Energy intake exceeded 50 kcal/kg per day after the first day. The cohort weight and head circumference measurements remained above the 10th percentile of intrauterine growth through 36 weeks postmenstrual age. Infants demonstrated successful growth by remaining above the 10th percentile for the following: 4 of 12 (33%) with birth weights 501-750 g, 16 of 26 (62%) with birth weights 751-1,000 g and 16 of 25 (64%) with birth weights 1,001-1,250 g. These differences were statistically greater than a large reference cohort (P < .0001). Length measurements declined below the 10th percentile of intrauterine growth at 36 weeks postmenstrual age. Conclusion was promptly providing premature infants with parenteral nutrition, including calories greater than the basal energy requirement, can produce postnatal growth that remains above the 10th percentile of intrauterine growth [10].
Methodology
Sample scheme and data collection methodology
Simple random sampling is the basic sampling technique where we select a group of subjects (a sample) for study from a larger group (a population). Each individual is chosen entirely by chance and each member of the population has an equal chance of being included in the sample. Therefore, this study we implemented simple random sampling technique.
Data collection: Data were collected from the clinic records. Height of the child and both parents were measured using the stadiometer by a trained single person at a given time. Each measurement was recorded as the average of three consecutive readings.
Study population: Preterm babies born in between 26 weeks to 34 weeks of POA. Children who were admitted to NICU at teaching Hospital Peradeniya, Children who are currently in the age range of 2yrs to 5yrs and Children who visited the clinic during the period of September to November 2014.
Sample size and case definition: Fifty babies who are being followed up at the clinic were participated. Children who are born preterm (26 weeks -34weeks) who were admitted to NICU at Teaching Hospital Peradeniya and currently in the age range of 2yrs - 5yrs.
Statistical analysis tool and descriptive analysis
The data set analysis using R software version 4.1.0 with rcmdr [11] packages. Descriptive analysis was used to compare means, variances, range to identify the central tendency and describe the basic features of data. Furthermore, correlation analysis was carried out among variables.
Correspondence analysis and contingency tables
In statistics, a contingency table (also known as a cross tabulation or crosstab) is a type of table in a matrix format that displays the (multivariate) frequency distribution of the variables. They are heavily used in survey research, business intelligence, engineering and scientific research. They provide a basic picture of the interrelation between two variables and can help find interactions between them.
Pearson's Chi-squared test [12]
Pearson's chi-squared test{\displaystyle \chi ^{2}} is a statistical test applied to sets of categorical data to evaluate how likely it is that any observed difference between the sets arose by chance. It is the most widely used of many chi-squared tests (e.g., Yates, likelihood ratio, portmanteau test in time series, etc).
Single-linkage clustering [13]
In statistics, single-linkage clustering is one of several methods of hierarchical clustering. It is based on grouping clusters in bottom-up fashion (agglomerative clustering), at each step combining two clusters that contain the closest pair of elements not yet belonging to the same cluster as each other.
Dendrogram [14-16]
A dendrogram is a diagram that shows the hierarchical relationship between objects. It is most commonly created as an output from hierarchical clustering. The main use of a dendrogram is to work out the best way to allocate objects to clusters. The dendrogram below shows the hierarchical clustering of six observations shown on the scatter plot to the left.
Inclusion and exclusion criteria
Preterm babies born in between 26 weeks to 34 weeks of POA, Babies born as singletons, Babies who didn’t suffer from chronic illnesses, and Babies who were exclusively fed with expressed breast milk during the neonatal period were included in the study.
Children born as a sibling of a multiple pregnancy, Babies who are not born in between 26 weeks to 34 weeks of POA, Babies who had gastrointestinal complications, Babies who were given parenteral nutrition during the neonatal period, and babies to whom expressed breast milk was not initiated during first two days of life due to surgical reasons were excluded.
Ethical issues
Ethical clearance was obtained from the Ethical Review committee of Teaching Hospital Kandy - Sri Lanka.
Data Analysis And Discussion
Our Data Set
|
Patient |
Sex |
Maturity (POA in weeks) |
Birth weight(kg) |
Present age (months) |
Current wt (kg) |
Height (cm) |
Mother ht |
Father ht |
Mid parental height |
Predicted ht |
|
1 |
m |
30 |
1.45 |
31 |
2.9 |
94 |
154 |
172 |
177.7-160.75 |
168 |
|
2 |
f |
32 |
1.6 |
60 |
13.6 |
98 |
151 |
154 |
156.25-173.26 |
152 |
|
3 |
m |
33 |
1.43 |
108 |
22.3 |
122 |
147 |
163 |
152.75-169.75 |
162 |
|
4 |
f |
29 |
0.662 |
36 |
9.4 |
77 |
146 |
165 |
157.75-140.75 |
140 |
|
5 |
f |
29 |
1.006 |
26 |
8.4 |
73 |
145 |
155 |
135.25-152.25 |
137 |
|
6 |
m |
31 |
1.1 |
31 |
11.6 |
88.5 |
149 |
164 |
171.25-154.25 |
164 |
|
7 |
m |
31 |
0.906 |
27 |
11.35 |
90 |
146 |
168 |
154.75-171.75 |
163 |
|
8 |
m |
31 |
1.4 |
39 |
10.1 |
88 |
149 |
161 |
152.75-169.75 |
162 |
|
9 |
f |
28 |
1.17 |
120 |
24.5 |
131 |
150 |
168 |
140.25-157.25 |
158 |
|
10 |
m |
32 |
1.46 |
62 |
14 |
104 |
155 |
172 |
156.25-173.27 |
171 |
|
11 |
f |
34 |
1.3 |
36 |
9.55 |
77 |
154 |
162 |
161.25-144.25 |
140 |
|
12 |
f |
26 |
1.15 |
72 |
15.7 |
100.5 |
151 |
168 |
161`.5-144.5 |
148 |
|
13 |
f |
28 |
1.398 |
60 |
16.7 |
107 |
155 |
156 |
156.25-173.29 |
160 |
|
14 |
m |
30 |
1.29 |
132 |
22.6 |
130 |
145 |
165 |
152.75-169.75 |
161 |
|
15 |
m |
33 |
1.05 |
108 |
17 |
120 |
153 |
168 |
158.25-175.25 |
159 |
|
16 |
f |
27 |
1.3 |
120 |
23.3 |
134 |
152 |
175 |
148.75-165.7 |
161 |
|
17 |
f |
29 |
1.27 |
36 |
11.2 |
93 |
158 |
173 |
151.25-167.75 |
161 |
|
18 |
f |
28 |
0.74 |
60 |
101 |
154 |
175 |
166.7-149.7 |
154 |
|
|
19 |
m |
33 |
1.09 |
48 |
9.95 |
89 |
141 |
170 |
165.75-148.75 |
158 |
|
20 |
m |
30 |
0.82 |
43 |
10.5 |
92 |
152 |
168 |
157.5-174.5 |
164 |
|
21 |
f |
30 |
1 |
39 |
10.25 |
93 |
161 |
162 |
159.25-176.25 |
162 |
|
22 |
m |
30 |
0.845 |
72 |
15.85 |
112 |
156 |
172 |
153.25-170.25 |
170 |
|
23 |
m |
30 |
0.96 |
72 |
13.5 |
104 |
146 |
170 |
155.75-172.75 |
164 |
|
24 |
f |
31 |
1.235 |
29 |
12.9 |
87 |
160 |
168 |
166.24-149.25 |
162 |
|
25 |
m |
34 |
1.68 |
48 |
13.3 |
99 |
147 |
163 |
152.75-169.75 |
162 |
|
26 |
m |
29 |
1.476 |
46 |
14.8 |
93 |
141 |
161 |
161.25-178.25 |
163 |
|
27 |
f |
32 |
1.29 |
59 |
14.4 |
104 |
152 |
180 |
156.25-173.28 |
158 |
|
28 |
m |
30 |
1.1 |
28 |
13.4 |
87 |
160 |
178 |
171.25157.25 |
163 |
|
29 |
m |
28 |
0.874 |
66 |
14.6 |
106 |
152 |
165 |
156.25-173.25 |
164 |
|
30 |
f |
34 |
1.35 |
38 |
11.8 |
94 |
147 |
163 |
135,25-151.75 |
160 |
|
31 |
m |
34 |
1.21 |
31 |
10.75 |
95 |
149 |
161 |
157.25-171 |
177 |
|
32 |
m |
31 |
1.4 |
32 |
13.2 |
88 |
156 |
164 |
174.75-157.75 |
168 |
|
33 |
f |
29 |
0.726 |
50 |
12 |
99 |
156 |
160 |
169.74-144.25 |
161 |
|
34 |
f |
30 |
1.3 |
79 |
16.3 |
114 |
169 |
150 |
147.75-161.75 |
160 |
|
35 |
f |
27 |
1.18 |
37 |
12.55 |
92 |
148 |
167 |
159.75-142.75 |
161 |
|
36 |
m |
32 |
1.4 |
39 |
12.5 |
94 |
155 |
158 |
149.25-157.25 |
156 |
|
37 |
f |
31 |
1.55 |
29 |
12 |
91 |
160 |
168 |
150-166 |
154 |
|
38 |
f |
30 |
1.06 |
70 |
16.05 |
122 |
148 |
154 |
153.25-136.25 |
145 |
|
39 |
f |
31 |
1.13 |
35 |
14.5 |
94 |
155 |
160 |
171-154 |
154 |
|
40 |
m |
30 |
0.832 |
59 |
12.7 |
103 |
165 |
173 |
171-154 |
154 |
|
41 |
m |
32 |
1.3 |
31 |
8.7 |
85 |
120 |
160 |
138-155 |
165 |
|
42 |
f |
32 |
1.1 |
36 |
12.1 |
95 |
152 |
155 |
139-156 |
165 |
|
43 |
m |
30 |
1.25 |
43 |
13.4 |
98 |
127 |
132 |
127.25-144.25 |
174 |
|
44 |
m |
33 |
1.3 |
26 |
11 |
87 |
167 |
170 |
166.25-183.25 |
173 |
|
45 |
m |
34 |
1.2 |
28 |
13 |
82 |
152 |
157 |
152.25-169.25 |
160 |
|
46 |
f |
34 |
1.95 |
24 |
9.1 |
85 |
152 |
177 |
149.75-166.75 |
162 |
|
47 |
f |
26 |
0.69 |
72 |
14.85 |
90 |
150 |
165 |
142.75-159.75 |
137 |
|
48 |
f |
34 |
1 |
26 |
7 |
85 |
150 |
145 |
132.75-149.75 |
158 |
|
49 |
f |
27 |
1.108 |
45 |
13.5 |
110 |
148 |
166 |
142.5-159.25 |
178 |
|
50 |
f |
31 |
1.6 |
26 |
12 |
78 |
155 |
185 |
155.25-172.25 |
154 |
Descriptive statistics of variables
According to the table 1, figures 3 and 4, means and variance of all variables are balanced with the Sample parameters.
|
|
Maturity POA (Weeks) |
Birth weight (kg) |
|
Min |
26.00 |
0.66 |
|
Max |
34.00 |
1.95 |
|
Average |
30.59 |
1.19 |
|
Standard Deviation |
2.24 |
0.27 |
Table 1: Descriptive Statistics in Maturity POA & Birth weight.
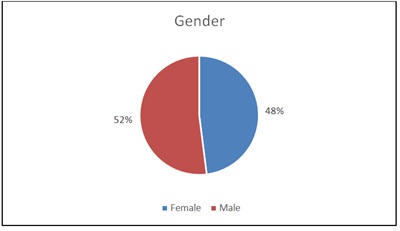 Figure 3: Gender Representation of Sample.
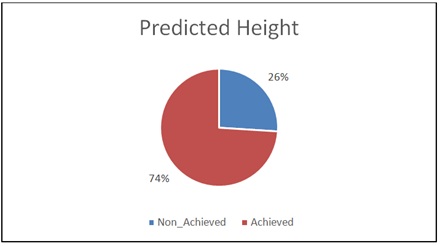 Figure 4: Mid Parental Height Achievement of Sample.
Pearson's product-moment correlation
According to the table 2, Birth weight and Maturity POA are averagely inter correlated indicating a positive correlation. Positive correlation indicates significant interdependence between variables.
|
Variable |
Birth weight |
Maturity (POA) |
|
Birth weight |
1 |
0.4245 |
|
Maturity POA |
0.4245 |
1 |
Table 2: Correlation between Birth weight vs maturity (POA).
According to the tables 3 and 4, P-value < 0.05, H0 is rejected at 5% significance level and correlation between predicted height and gender is not equal to zero at 5% significance level. Therefore, predicted height and gender indicates significant interdependence relationship.
|
Variable |
Predicted height |
|||
|
Gender |
Non Achieved |
Achieved |
Total |
|
|
female |
10 |
16 |
26 |
|
|
male |
3 |
21 |
24 |
|
|
Total |
13 |
37 |
50 |
|
Table 3: Contingency analysis for Gender vs. Predicted height.
Hypothesis:
H0: True correlation is equal to Zero.
H1: True correlation is not equal to Zero.
|
X-squared = 4.3719, df = 1, p-value = 0.0365 |
Table 4: Pearson's Chi-squared test.
Single-linkage clustering dendrogram
According to the figure 5, the dendrogram shows 5 main clusters in this study, the task that consists in grouping a set of experiments (observations) in such a way that element belonging to the same group are more similar (in some mathematical sense) to each other than to those in the other groups. Tested 50 children who were born as preterm babies were separated 3 main groups. According to the dendrogram and statistical results, we can prove that there are mid parental height achieved group, mid parental height non-achieved group and extreme outlier case of the sample. Further, babies in mid parental height achieved group represent much closer characteristics to each other clinically and mathematically.
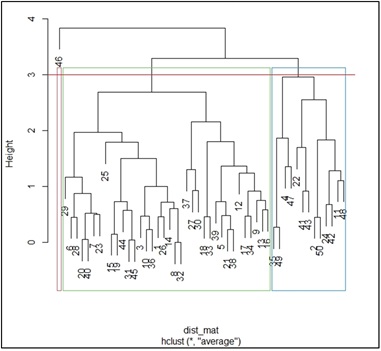 Figure 5: Mid Parental Height Achievement Dendrogram for the sample.
Conclusion
In our statistical analysis we found that 74% of children have achieved a height which is within the predicted mid-parental height range. This shows premature babies achieve their predicted heights even without providing additional nutrition by parenteral route or with fortified formulas during neonatal period.
P-value < 0.05, H0 is rejected at 5% significance level and correlation between predicted height and gender is not equal to zero at 5% significance level. Therefore, predicted height and gender indicates significant interdependence relationship.
Tested 50 children who were born as preterm babies were separated into 3 main groups in cluster analysis. According to the dendrogram and statistical results, we can prove that there are mid parental height achieved group which show 74%, mid parental height non-achieved group and extreme outlier case of the sample. Babies of the predicted mid parental height achieved group, represent much closer characteristics to each other clinically and mathematically.
Finally, when considering nutrition of premature babies, we can conclude that statistically significant proportion achieve their predicted mid parental height during the period of 2-5 years. We need to follow this group during pubertal growth spurt and also during adolescence to see whether there is an impact on adult height.
References
- Lucas A, Morley R, Cole TJ, Gore SM, Lucas PJ, et al. (1990) Early diet in preterm babies and development status at 18 months. Lancet 335: 1477-1481.
- Dinerstein A, Nieto RM, Solana CL, Perez GP, Otheguy LE, et al. (2006) Early and aggressive nutritional strategy (parenteral and enteral) decreases postnatal growth failure in very low birth weight infants. J Perinatol 26: 436-442.
- Puthoff T, Dumm M, Jones A, Collins K, Curtiss J, et al. (2009) This clinical guideline from Great Ormond Street Hospital (GOSH) discusses nutritional requirements for preterm infants receiving enteral nutrition. It does not give guidance on the prescription of parenteral nutrition (PN). Rontamil 29: 428-323.
- Ben XM (2008) Nutritional management of newborn infants: Practical guidelines. World J Gastroenterol 14: 6133-6139.
- Gidrewicz DA, Fenton TR (2014) A systematic review and meta-analysis of the nutrient content of preterm and term breast milk. BMC Pediatrics.
- Ayede AI (2011) Achieving optimal feeds for preterm babies, recommendations and realities in practice: Nigerian perspective. AnnIb Postgrad Med 9: 1-7.
- Davies DP (1977) Adequacy of expressed breast milk for early growth of preterm infants. Research Article Arch Dis Child 52: 296-301.
- Maas C, Wiechers C, Bernhard W, Poets CF, RFranz A (2013) Early Feeding of fortified breast milk in hospital growth in very premature infants: A retrospective cohort analysis. BMC Pediatr 13: 178.
- Moyses HE, Johnson MJ, Leaf AA, Victoria R (2013) Early parenteral nutrition and growth outcomes in preterm infants a systematic review and meta-analysis. The American Journal of Clinical Nutrition 97: 816-826.
- Herrmann KR, Herrmann KR (2010) Early parenteral nutrition and successful postnatal growth of premature infants. nutrition in clinical practice 25: 69-75.
- Fox J (2005) The R commander: A basic statistics graphical user interface to R. Journal of Statistical Software 14: 1-42.
- Plackett RL (1983) Karl Pearson and the chi-squared test. International Statistical Review/Revue Internationale de Statistique 51: 59-72.
- Gower JC, Ross GJ (1969) Minimum spanning trees and single linkage cluster analysis. Journal of the Royal Statistical Society: Series C (Applied Statistics) 18: 54-64.
- Phipps JB (1971) Dendrogram topology. Systematic zoology 20: 306-308.
- Up to date (2021) Parenteral nutrition in premature infants. up to date, Massachusetts, United States.
- Peter J (2010) The influence of early postnatal nutrition on retinopathy of prematurity in extremely low birth weight infants. Early Hum Dev 86: 391-396.
Citation: Bandara S, Rathnathilake RMGSB, Bandara DDDS, Muniweera ALKR (2021) Growth in Early Childhood of Children Who are Born Prematurely and Exclusively Fed with Expressed Breast Milk in the Neonatal Period. J Neonatol Clin Pediatr 8: 089.
Copyright: © 2021 Bandara S, et al. This is an open-access article distributed under the terms of the Creative Commons Attribution License, which permits unrestricted use, distribution, and reproduction in any medium, provided the original author and source are credited.