Land Suitability Assessment for Maize (Zea mays L) Production using Integrated DEMATEL-ANP Model and GIS in the Foumbot Agricultural Basin (Cameroon Western Highlands)
*Corresponding Author(s):
Bertrand KenzongDepartment Of Soil Science, Faculty Of Agronomy And Agricultural Sciences, University Of Dschang, BP 222, Dschang, Cameroon
Email:kenzongbertrand@gmail.com
Abstract
Till date, detailed information on soil and environmental characteristics, which are major factors negativelt affecting agricultural practice in Sub-Saharan Africa, are limiting.The aim of this study was to assess suitable land for sustainable maize (Zea mays L) production in a highland ecosystem in Western Cameroon using multi-criteria decision making (MCDM) approach and geographic information system (GIS). Eight (8) environmental criteria were identified as being the most relevant for maize production in the area and their thematic maps were prepared usingArcGIS 10.3. The next step consisted in computing criteria weights using Decision Making Trial Evaluation Laboratory (DEMATEL) technique, integrated with Analytical Network Process (ANP). Thereafter, an initial suitability map was obtained using the weighted overlay analysis (WOA) in ArcGIS,meanwhile a final suitability map for maize production was generated after removing non agricultural lands from the initial suitability map. The results indicate that slope has the highest specific weight and hence the greatest influence on land suitability for maize production, followed by pH (0.204), elevation (0.191) and soil drainage (0.095). The land suitability map showed that 99% of foumbot's agricultural land is suitable for maize production, but this suitability varies from very highly to marginally suitable. Furthermore, 8056 ha or 11% are very highly suitable, 21119 ha or 29% are highly suitable, 38% or 27405 ha are moderately suitable and 20% or 14422 ha are marginally suitable. The remaining 1% that falls under non suitable classe represents 606 ha and located on the steep slopes around the Mount Mbappit. The kappa analysis used to assess the accuracy of the established suitability map reveals a total overall accuracy of 78.67% and a kappa value of 0.7256 with an asymptotic error of 0.058 which is good. This research recommends that the GIS and DEMATEL-ANP multicriteria analysis model should be extended to future works to select suitable lands for increasing maize production in other ecosystems.
Keywords
Analytical Network Process; Decision Making Trial Evaluation Laboratory; Geographic Information System; Land suitability; Maize; weighted overlay analysis.
Introduction
Maize occupies an important place in the various functions of agricultural production in Cameroon. In terms of food production, maize is the leading cereal consumed in the country (2/3 of production, i.e., approximately 1.3 million tons in 2020, far ahead of sorghum, rice, and wheat. Maize production is also used to supply local agro-industries (2 % for breweries and 16% for animal feed mills) and countries in the sub-region . However, the sector is not spared from the generic constraints of the agricultural sector in Cameroon (uncontrolled use of land resources, low productivity, under-exploitation of available natural resources, etc.). As a result, the evolution of production has not kept pace with population growth. The growth of agribusinesses and the increasing demand from neighboring countries are contributing to the widening gap between domestic supply and demand . The growing demand for maize could be met either through an increase in cultivated areas or through appropriate technological intervention. In a context where the pressure on land resources for different uses is increasing, it is hardly feasible to bring more land under cultivation. However, the market demand for maize could be met through technological interventions such as growing maize in appropriate areas with high-yielding hybrid varieties and adopting a set of improved practices. Thus, there is a need to accurately identify suitable land for maize cultivation in Cameroon in general and in its main agricultural basins in particular, such as the Foumbot district. Land suitability assessment is the first step in the process of sustainable land use planning or management [3, 4].
Land suitability assessment guides towards an optimal land use by providing information on opportunities and constraints in the use of a given area [5-7].Land suitability is a multi-criteria problem because it involves the use of several criteria that may be socio-economic or environmental in addition to properties inherent to the land unit in question [5, 8].In Cameroon, some works have been conducted to assess the suitability of land for crops production [9-13]. These studies are inadequate to decide on the best use of land resourcesbecause they used empirical methods which consider the same level of singnificance for all evaluation criteria.It is therefore necessary to use modern methods that can better express the real potential of the highland ecosystem of Western Cameroon for crop production.
For decades, several studies have applied the MCDM methods for land suitability assessment (LSA) [14-20] considering that the criteria do not have the same level of significance as is the case with empirical methods. However, many advances have been observed during the last twenty (20) years in the implementation of MCDM methods for LSA, especially by combining GIS with MCDM methods [21-26]. The most commonly used MCDM methods for LSA are Analytic Hierarchy Process (AHP), Analytic Network Process (ANP), the Technique for Order of Preference by Similarity to Ideal Solution (TOPSIS), Simple Additive Weighting (SAW), and Decision Making Trial and Evaluation Laboratory (DEMATEL) [27, 28]. But each MCDM method has its advantages and disadvantages for solving problems. Most MCDM methods assume that the criteria do not interact with each other, which is not the case in many real-life problems;several forms of interactions between criteria can occur, thus requiring more sophisticated/intelligent MCDM techniques to meet the particular needs of the problem under consideration [29].
The DEMATEL method was developed by the Science and Human Affairs Program of the Battelle Memorial Institute in Geneva [30], and is well known for its ability to deal with the degree of importance of the evaluation criteria, and more importantly, to establish cause and effect relationships between the evaluation criteria [31, 32]. The ANP method was developed by [33] to overcome the hierarchical shortcomings in the AHP [34]. In addition, the ANP method is used to determine the composite weights of the criteria through the development of a "supermatrix" [26]. However, the ANP method when used alone has some flaws which can lead to incoherent judgment, and then to poor results [35]. Therefore, the combination of the DEMATEL and ANP methods has been extensively explored [36-42] and has been adopted to address the imperfections of the ANP method. But only a few studies have used this integrated method for LSA so far [43-47].None of these studies have been conducted in Africa, let alone in Cameroon. The aim of this study is to assess suitable land for sustainable maizeproduction in a highland ecosystem of Western Cameroon using DEMATEL-ANP integrated approach and GIS. The objective of this work is to test the applicability that approach in sub-Saharan Africa in general and in the highlands of western Cameroon in particular for LSA. The results obtained will provide data to farmers on the management strategies to be adopted on such soils for optimum maize production in the Cameroon Western Highlands.
Materials And Methods
Description of the study area
The study area is located in the FoumbotSub-division in the Cameroon Western Highlands between 5°12'00 '' and 5°40'00 N and 10°30'00 '' and 10°50'00 E (Figure 1). It has a surface area of about 84488 ha. There are three major physiographic units namely mountains, plateaus and valleys. The highest and lowest altitudes are 1967 and 876 m, respectively. This area is characterized by a long rainy season from March to October with an average annual rainfall of about 3000 mm and an annual average temperature of 21° C [48]. The major soil types are Andosolsand RedFerralsolsmeanwhileGleysols cover the swampy lowlands. The area is drained mainly by small streams in addition to NkoupRiver which crosses longitudinally a major part of the study area. The basement of the region is essentially formed by metamorphic rock (gneiss and migmatites) intruded by various granitoids. This geological substratum is covered by a thick layer of pyroclastics [49]. The main activity of population in the area is subsistence agriculture. Dominant crops of the area are maize, tomato, beans soybeans andirich potato.
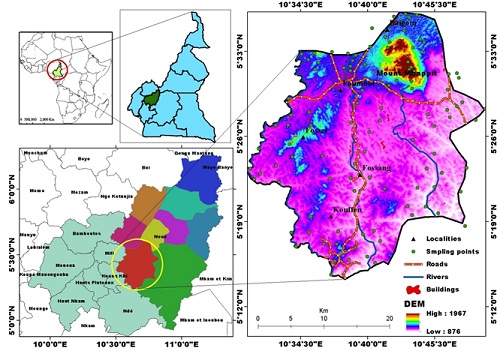 Figure 1: Location of the study area and sampling points.
Input data and softwares used
The input data used was selected according to the criteria used to assess the suitability of study area for maize production. These include topographic data (Topographic map and Digital Elevation Model), soil data (Soil somple collected in the field), sofwares (SuperDecision, ArcGIS and Excel 2013) and maize yield data (over a periode of 03 yearsfrom2018-2020).
Choice of land use type
The choice of land use type (crops) for LSA was made on the basis of economic and food importance following the results of the census carried out by the Foumbotcouncil in 2018 over14752 household in the area and observations on the ground [50]. Maize was identified as the most important crop in the locality.
Evaluation criteriaselection.
The selection of evaluation criteria is a technical process that is based on expert knowledge and existing literature. Five (5) experts (Researchers) working at the Agricultural Research Institute for Development (IRAD) of Foumbot participated in the criteria selection process, identification of the suitable ranges of each criterion, and evaluation of the weights of criteria. These experts have worked at least fifteen years at the office of the IRAD and have been working in Foumbot for more than ten years. After discussion with the experts during the field survey period and analysis of the existing literature [4, 51-53], eight criteria were identified to be most relevant for the suitability assessment of maize production areas in Foumbot. These criteria were basically soil factors (soil reaction, soil depth, soil texture, coarse fragment, soil drainage and CEC), and topography factors (slope, elevation) (Table 1).
|
Criteria |
Suitability classes |
|||||
|
Veryhighlysuitable |
Highlysuitable |
Moderatelysuitable |
Marginaly Suitable |
Temporalyunsuitable |
Permenentlyunsuitable |
|
|
100 95 |
95 85 |
85 60 |
60 40 |
40 25 |
25 1 |
|
|
Topographycriteria |
||||||
|
Slope (%) |
0-2 |
2-5 |
5-8 |
8-16 |
16-25 |
>25 |
|
Elevation (m) |
< 1100 |
1100-1150 |
1150 - 1200 |
1200 - 1250 |
1250-1300 |
> 1300 |
|
Coarse fragments (%) |
0- 3 |
3 – 15 |
15 - 35 |
35 - 55 |
- |
> 55 |
|
Soilcriteria |
||||||
|
Soildepth (cm) |
>100 |
100 – 75 |
75 - 50 |
50 - 20 |
- |
<20 |
|
Soil texture (classes) |
C<60s, Co, SiC, SiCL, Si, SiL, CL |
C<60v, SC, C>60s, L, SCL |
C>60v, SL, LfS, LS |
Fs, S, LcS |
- |
Cm, SiCm, CS |
|
Soilreaction (pH) |
6.6 - 7 |
6.6 – 5.8 |
5.8 – 5.6 |
5.6 – 5.2 |
<5.2 |
- |
|
CEC Clay (Meq/100g clay) |
>24 |
24 -16 |
16 - 8 |
8 - 5 |
- |
<5 |
|
Drainge (classes) |
Good |
Moderate |
Marginal |
Imperfect |
Poor |
Water bodies |
Table 1: Crop requirements for maize in relation to selected criteria.
Adapted from : Muhammad et al. 2021 ; Pilevar, et al. 2020 ; Tsahayo et al. 2020 ; Seyedmohammadi et al. 2018 ; Abagyeh et al. 2016 and Sys et al. 1993.
Methodology
Field works
Field work consisted in the identification and collection of soil samples. For this purpose, the soil samples were collected at a lag distance of about 20 m and at a depth of about 30 cm. At each sampling point, 5 samples were collected around the said point at a distance of about 2 m and then mixed to obtain a composite soil sample. A total of 109 composites samples were obtained as shown in Figure 1.
Laboratory analysis
The laboratory analyses were carried out according to the procedures described by [54]. Soil organic Carbon (SOC) content was determined by the Walkley and Black method [55].Total nitrogen (N) and available phosphorous were determined by the Kjeldahl wet digestion and the Bray II methods [56], respectively. Exchangeable bases were determined following the Schollenberger method using a 1 M ammonium acetate solution buffered at pH 7 [57]. The concentrations of sodium (Na+) and potassium, (K+) ions in the extract were determined by flame photometry, and those of calcium (Ca2+) and magnesium (Mg2+) by complexometry using a 0.002 M disodium ethylenediaminetetraacetatedihydrate (Na2-EDTA) solution. CEC was determined by a direct continuation of the Schollenberger’s method using a 1 N potassium chloride (KCl) saturation solution. Exchangeable aluminum (Al3+) was determined after displacement by a 1 N KCl solution while amorphous iron (Fe) and Al were determined by acid ammonium oxalate extraction [57]. The hydrometer method was used for particle size analysis following procedures described by [58]. 2.5 N solution of sodium hexametaphosphate was used to ensure proper dispersal of the soils. 1:2 soil-hydrogen peroxide and 1:2 soil-KCl solutions were used for pH-H2O and pH-KCl determinations respectively.
Land suitability assessment
Land suitability analysis is a method of land evaluation that measures the degree of suitability of land for a certain purpose [3].The GIS-based multicriteria evaluation (GIS-MCE) procedure for the land suitability assessment includes several stages that are framed in the methodological flowchart below (Figure 2). The determination of the relevant criteria was the first step, followed by their standardization, the determination of their weight or impact, the overlaying ofcriteria with their weights and finally the validation of the suitability map established using maize yield in the locality over a period of three year (2018-2020). The procedures and algorithms available in ArcGIS 10.8 were employed to implement the assessment.
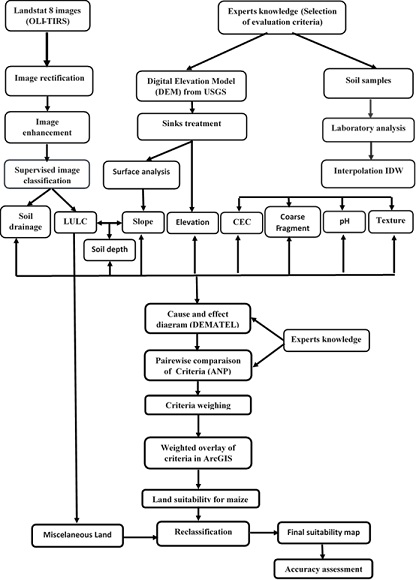 Figure 2: Procedure for assessing land suitability for maize production in Foumbot.
Standardization and spatial variability of the evaluation criteria
Evaluation criteria have different units; for example slope is measured in percentage and soil depth in centimeters, etc... It is therefore necessary to standardize them by bringing them to a common scale before their superposition during LSA [59]. According to [60], linear scale transformation is the most common method used to standardize criteria during land suitability map establishment. In this study, criteria thematic maps (Figure 4) were standardized using reclassify spatial analyst tool, to make sure that each criterion has an equivalent measurement basis. Simultaneously during reclassification, factor ratings were also assigned for suitability analysis as it was done by [61] (Table 2).
|
Main criteria |
Sub-criteria |
Score |
Area (ha) |
Area (%) |
|
Slope |
0 – 2 |
1 |
2191 |
3 |
|
2 – 5 |
2 |
10427 |
12 |
|
|
5 – 8 |
3 |
14107 |
17 |
|
|
8 – 16 |
4 |
32696 |
39 |
|
|
16 – 25 |
5 |
15353 |
18 |
|
|
> 25 |
6 |
9291 |
11 |
|
|
Altitude |
< 1100 |
1 |
70089 |
83 |
|
1100 – 1250 |
2 |
10882 |
12.9 |
|
|
1250 – 1400 |
3 |
1538 |
1.8 |
|
|
1400 – 1650 |
4 |
1699 |
2.0 |
|
|
1650 – 1800 |
5 |
198 |
0.2 |
|
|
> 1800 |
6 |
76 |
0,1 |
|
|
Coarse fragment |
3 – 15 |
2 |
80180 |
94.9 |
|
15 – 35 |
3 |
4308 |
5.1 |
|
|
Soil depth |
> 100 |
1 |
67935 |
80.4 |
|
75 – 100 |
2 |
14151 |
16.7 |
|
|
50 – 75 |
3 |
2120 |
2.5 |
|
|
20 - 50 |
4 |
280 |
0.3 |
|
|
Soil texture |
SiCL, SiL, CL, C<60s |
1 |
47592 |
56.3 |
|
L, SCL |
2 |
36892 |
43.7 |
|
|
Soil reaction |
5.8 – 6.2 |
2 |
5000 |
5.9 |
|
5.5 – 5.8 |
3 |
28021 |
33.2 |
|
|
5.2 – 5.5 |
4 |
50698 |
60.0 |
|
|
< 5.2 |
5 |
769 |
0.9 |
|
|
CEC clay |
> 24 |
1 |
15544 |
18.4 |
|
16 -24 |
2 |
40680 |
48.1 |
|
|
8 - 16 |
3 |
28264 |
33.5 |
|
|
Drainage |
Very Good |
1 |
4371 |
5.2 |
|
Good |
2 |
8314 |
9.8 |
|
|
Moderate |
3 |
25301 |
29.9 |
|
|
Marginal |
4 |
31699 |
37.5 |
|
|
Poor |
5 |
14803 |
17.5 |
Table 2: Areal and percentile distributions of criteria and sub-criteria parameter in the study area.
Criteria weight determination
This study uses an intergrated DEMATEL-ANP method to determine criteria weights.Since in real life there are different levels of influence and different types of relationship between the evaluation criteria, it would be irrational to consider equal levels of influence and the same type of relationship between them.
DEMATEL analysis
The DEMATEL method was used to deal with the importance and causal relationships among the criteria, and to recognize the influential criteria of the LSA for Maize. In this study, Excel 2013 was used to compute the six major steps involved in the DEMATEL technique as follow.
Step 1:Establish measurement scales and determine the direction and degree of influence between factors.
This step entails identifying and defining criteria that influence maize production in the study area by using data obtained from literature review, brainstorming, or expert opinions (see section 2.4).The five (5) experts were asked to assess the direct influence between two criteria. A measurement scale of 0, 1, 2, 3 and 4 was used to illustrate respectively no influence, very weak influence, weak influence, moderate influence and very strong influence in reference to [62].
Step 2: Establish a direct relation matrixZ.
The direct relationship matrix was constructed from the arithmetic mean of the pairwise comparison matrices generated by each expert and is determined as shown in equation (1) below. In this equation, corresponds to the degree of influence of criteria i on criteria j.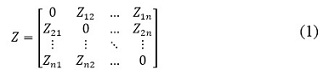 Step 3:Establish the normalized matrix N.
The normalized matrix is obtained from equations (2) and (3) by dividing each element of the initial direct influence matrix by the maximum value of the sum of the row. All diagonals in the matrix are zero, and the sum of each row and column does not exceed 1.
 Step 4:Establish the total relation matrix T
The total relationship matrix (T) was then calculated from the normalized direct influence matrix using equation (4) where I denotes the identity matrix.
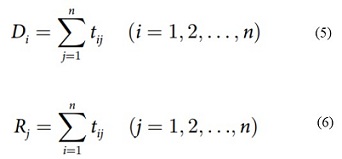
 Step 5:Calculate the sum of the values in each column and each row.
This step entails summing the values of each column and row in the total relation matrix, where Di is the sum of the row and Rj is the sum of the column. The and values represent both the direct and indirect influences between factors.
Step 6: Illustrate the DEMATEL cause and effect diagram.
In this step, (D + R) is defined as Prominence and k = i = j = 1, 2, . . .n, illustrating the overall influential directions of a service attribute. The parameter (D − R) is defined as relation, illustrating the difference in the influences of this service attribute. This value indicates the level of influence of the criterion k. A positive value suggests that the criterionconcerned is a cause and a negative value suggests that the attribute is an effect. In the cause and effect diagram, criteria are plotted on the horizontal axis according to the (D + R) value and on the vertical axis according to the (D − R) value.
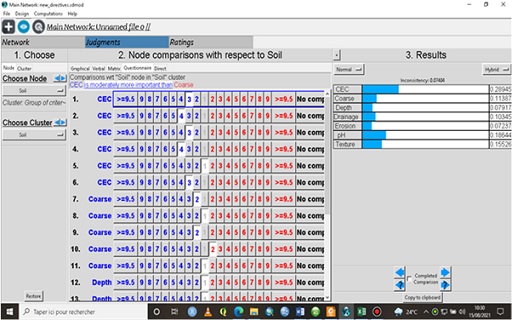 Fig 3: Sample questionnaire for pairwise criteria comparison.
The causal diagram was attained by depicting all dataset of the (Di-Ri, Di+Ri), where the vertical axis is Di-Riand the horizontal axis is Di+Ri. The Network Relation Map (NRM) is a proper diagram, which presents a valuable insight for decision making. NRM can be obtained by defining a threshold value based on the opinions of experts. It also constructs a structural relationship between the different influence factors to visualize complex correlation. For the given reason, negligible relationships should be filtered out from the total-relation matrix (T). However, only relationships that are greater than the defined value should be shown in the graph.
Analytic Network Process (ANP) analysis
The results of DEMATEL analysis were used to refine the ANP conceptual model. Super Decisions software [63] was used for ANP to obtain the final weights. A pairwise comparison questions with Saaty’s nine-point scale were elaborated and submitted to experts on maize cultivation working in Foumbot. The questionnaire was mounted based on the ANP model and a relation network structure among the criteria. In the survey, they were asked questions such as: In a maize production activity in Foumbot, how much more important is “Cation Exchange Capacity” compared with “soil reaction”? The answers provided by the experts were synthesized and entered into the SuperDecision software for further calcultions to obtain criteria weights (Figure 3).
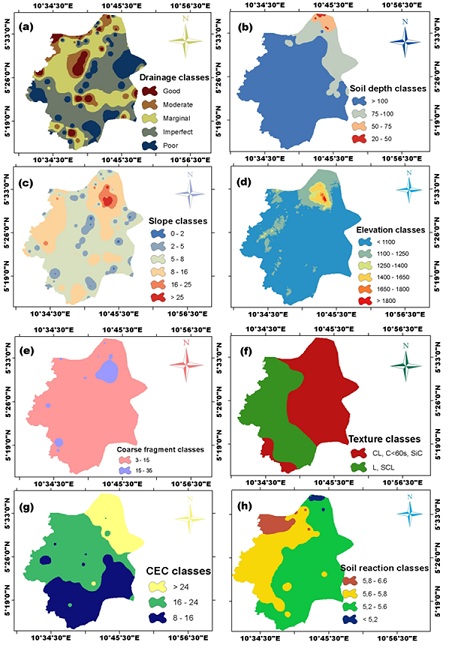 Figure 4: Spatial distribution of criteria in the study area (a) Soil drainage, (b) Soil depth, (c) Slope, (d) Elevation, (e) Soil coarse fragment, (f) Soil texture, (g) CEC, (h) Soil reaction.
|
|
C1 |
C2 |
C3 |
C4 |
C5 |
C6 |
C7 |
C8 |
|
C1 |
0.021 |
0.120 |
0.168 |
0.275 |
0.130 |
0.306 |
0.347 |
0.344 |
|
C2 |
0.180 |
0.021 |
0.056 |
0.125 |
0.158 |
0.189 |
0.218 |
0.219 |
|
C3 |
0.000 |
0.000 |
0.035 |
0.018 |
0.133 |
0.258 |
0.294 |
0.171 |
|
C4 |
0.000 |
0.000 |
0.020 |
0.009 |
0.067 |
0.162 |
0.184 |
0.090 |
|
C5 |
0.000 |
0.000 |
0.086 |
0.070 |
0.024 |
0.198 |
0.277 |
0.163 |
|
C6 |
0.000 |
0.000 |
0.017 |
0.005 |
0.007 |
0.034 |
0.205 |
0.076 |
|
C7 |
0.000 |
0.000 |
0.067 |
0.005 |
0.013 |
0.094 |
0.049 |
0.077 |
|
C8 |
0.000 |
0.000 |
0.087 |
0.067 |
0.077 |
0.302 |
0.340 |
0.061 |
Table 3: Total relation matrix based on DEMATEL survey of experts in maize production
C1 : slope ; C2 : Elevation ; C3 : Coarse fragment ; C4 : Soildepth ; C5 : Soil texture ; C6 : Soilreaction ; C7 : CEC ; C8 : Soil drainage
Establishment of maize suitability map
The land suitability map for maize production in the Foumbot agricultural basin was created using WOA in ArcGIS 10.3 by assigning weight to each criterion (Figure 8). Each raster was assigned a percentage influence depending on its importance as defined by the average weights obtained at the end of the DEMATEL-ANP analysis (Table 5). Each criterion was multiplied by its percentage influence and then added to create the output raster. The Equation (7) below was used to calculate land suitability index (LSI).
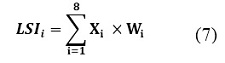 Where, = Raster map of each criterion, = weight values of each criterion, and = Land Suitability Index of cell i.
The final suitability map of the study area for maize production was generated after removing non agricultural lands from the suitability map obtained above using Equation (8) below. 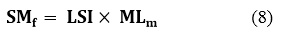
Where is the final suitability map, is the initial suitability map obtained using equation (7) and is the Miscellaneaous (non agricultural) land map.
This study used six levels (Table 2) of suitability classes commonly used by the Food and Agricultural Organization [73] very highly suitable (S1-0), highly suitable (S1-1), moderately suitable (S2), marginally suitable (S3), temporally unsuitable (N1) and permanently unsuitable (N2)].
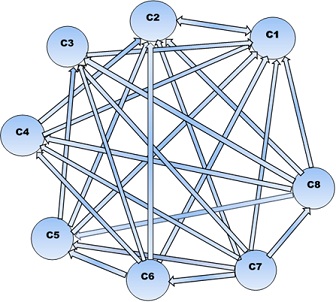 Figure 5: Network relation matrix deplicting influence of various evaluation criteria
Validation of the land suitability map
The assessment of the accuracy of a suitability map consists of comparing the data obtained from the LSA model with reference data existing in the field [64].The validation of thesuitabilitymap established from this model was made to ensure that the model is reliable and can be recommended for similar studies in other ecosystems. For this, maize yield data obtained from the MINADER over a period of three years (2018-2020) was used. Then land suitability indexes were compared to maize yield values. For this study, Cohen's kappa coefficient was used to validate the Foumbotland suitability map for maize because it accurately measures the agreement between the verified data (maize yield) and those predicted on the suitability map. The Kappa coefficient is a measure of the degree of agreement between nominal or ordinal evaluations made by several evaluators when analyzing the same samples. It is an index that "removes" the portion of chance or subjectivity from the agreement between techniques or methods [65]. Cohen's Kappa coefficient (K) was calculated from the error matrix using the formula below:
Results
Descriptive statistics of land characteristics
Descriptive statistics of land characteristics thatwere identified as having an influence over the suitability of Foumbot agricultural land for maize production are shown in table 3 below. Sand is the only criterion which has a slightly negative skweness coefficient (-1.03). This indicates values distribution shifted to the right of the median and therefore a distribution tail spread to the left. The other parameters have a slightly positive coefficient varying from 0 to 0.73. These values indicate that the data are normally distributed. An application of the Kolmogorov-Smirnov test confirmed the previous claim that all soil properties involved in this study are normally distributed for p<5%.According to the categorization of the coefficient of variation suggested by [66], CEC and soil depth are considered to be factors whose values vary greatly because their coefficient of variation are greater than 35%. The values of coarse fragments, clay, silt and sand vary moderately since their CVs are between 15 and 35%. Finally the pH values vary very little because the CV is less than 15% (Table 4).
|
Min |
Max |
Mean |
Median |
Std.dev |
Skweness |
Kurtosis |
|
|
CEC |
8.40 |
38.40 |
19.95 |
18.80 |
6.98 |
0.19 |
-0.73 |
|
Soil reaction |
4.80 |
6.20 |
5.55 |
5.50 |
0.24 |
0.01 |
0.33 |
|
Coarse fragment |
7.90 |
19.00 |
12.58 |
12.40 |
2.30 |
0.53 |
0.29 |
|
Soil depth |
45.00 |
260.00 |
123.90 |
110.00 |
54.52 |
0.59 |
-0.86 |
|
Clay |
20.00 |
55.00 |
32.66 |
32.00 |
7.65 |
0.70 |
0.09 |
|
Silt |
20.00 |
52.00 |
33.52 |
32.00 |
6.04 |
0.73 |
0.49 |
|
Sand |
7.00 |
50.00 |
33.98 |
36.00 |
10.52 |
-1.03 |
0.51 |
Table 4: Descriptive statistics of soil related evaluation criteria.
Criteria weighing
DEMATEL analysis
The five experts in the field of maize production working at the Agricultural Research Institute for Development (IRAD) in Foumbot indicated the level of direct influence between the evaluation criteria as described in Section 3.5.1. The direct relationship matrix was developed using equation (1) to combine all the expert evaluations. Then, the total relationship matrix that shows all the interactions that exist between the factors will be obtained from the normalized direct influence matrix using equations (2) and (4) as shown in Table 5.
|
Criteria |
Codes |
Di |
Ri |
Di+Ri |
Di-Ri |
|
Slope |
C1 |
1.713 |
0.201 |
1.025 |
1.512 |
|
Elevation |
C2 |
1.166 |
0.141 |
1.087 |
1.025 |
|
Coarsefrag |
C3 |
0.909 |
0.537 |
1.446 |
0.372 |
|
Soildepth |
C4 |
0.532 |
0.574 |
1.106 |
-0.042 |
|
Soil texture |
C5 |
0.818 |
0.608 |
1.426 |
0.210 |
|
Soilreaction |
C6 |
0.344 |
1.543 |
1.887 |
-1.199 |
|
CEC clay |
C7 |
0.305 |
1.915 |
2.220 |
-1.610 |
|
Soil drainage |
C8 |
0.933 |
1.201 |
2.133 |
-0.268 |
Table 5: Total influence and relation between criteria based on DEMATEL survey of experts in maize production.
C1 : slope ; C2 : Elevation ; C3 : Coarse fragment ; C4 : Soil depth ; C5 : Soil texture ; C6 : Soil reaction ; C7 : CEC ; C8 : Soil drainage ; Di : Sum of row of the total relation matrix ; Ri : Sum of column of the total relation matrix ; Di+Ri : Relationship vector ; Di-Ri : Influence vector
Equations (4) and (5) were used to calculate the influence vector (Ri-Di) and the relationship vector (Di+Ri) for the eight evaluation criteria as shown in table 6. From this same table 6 it is realized that the altitude, slope, coarse fragment and soil texture have a positive value of Di-Ri; they are therefore considered to be effect factors and thus affect the other factors, while CEC, soil drainage and soil pH are the most influential factors. In addition,CECclayand soil drainage interact the most with the other factors because they have the highest Di+Rivalues and the slope has the least interaction with the other criteria.
|
|
Goal |
CEC |
Coarse fragment |
Soildepth |
Soil drainage |
Soilreaction |
Soil texture |
Elevation |
Slope |
|
Goal |
0.000 |
0.000 |
0.000 |
0.000 |
0.000 |
0.000 |
0.000 |
0.000 |
0.000 |
|
CEC |
0.076 |
0.000 |
0.442 |
0.000 |
0.000 |
0.000 |
0.442 |
0.290 |
0.290 |
|
Coarse fragment |
0.032 |
0.000 |
0.100 |
0.000 |
0.000 |
0.000 |
0.100 |
0.060 |
0.060 |
|
Soildepth |
0.061 |
0.000 |
0.000 |
0.000 |
0.000 |
0.000 |
0.000 |
0.030 |
0.030 |
|
Soil drainage |
0.095 |
0.000 |
0.078 |
0.000 |
0.000 |
0.000 |
0.078 |
0.094 |
0.094 |
|
Soilreaction |
0.191 |
0.000 |
0.316 |
0.000 |
0.000 |
0.000 |
0.316 |
0.203 |
0.203 |
|
Soil texture |
0.048 |
0.000 |
0.064 |
0.000 |
0.000 |
0.000 |
0.064 |
0.047 |
0.047 |
|
Elevation |
0.204 |
0.000 |
0.000 |
0.000 |
0.000 |
0.000 |
0.000 |
0.072 |
0.072 |
|
Slope |
0.292 |
0.000 |
0.000 |
0.000 |
0.000 |
0.000 |
0.000 |
0.204 |
0.204 |
Table 6: Limited matrix with criteria weight
The last step of the DEMATEL analysis consisted in establishing the Network Relationship Model (NRM) and the causes and effects diagram using tables 5 and 6. In order to build a better network relationship model, it was considered necessary to fix a threshold value beyond which there is influence of one factor over another. In this study, this value was obtained by calculating the average of the values in Table 6 as recommended by the DEMATEL method. Hence, a threshold value of 0.119 was obtained and validated by the 5 field experts.Therefore, values greater than the threshold value of 0.119 in Table 5 are compiled and included in the NRM, as shown in Figure 6, wherebydirectand indirect interactions between factors are illustrated using this map. Based on the opinions of experts, only the most influenced relations are selected from the total relation matrix (Table 5).Elevation doesn’t have interrelationship with the other factors. Also, soil reaction, CECclay and soil drainage factors have high interrelationships with other factors. Furthermore, all evaluation factorsexcept the soil reaction and CEC are also affected by other factors. 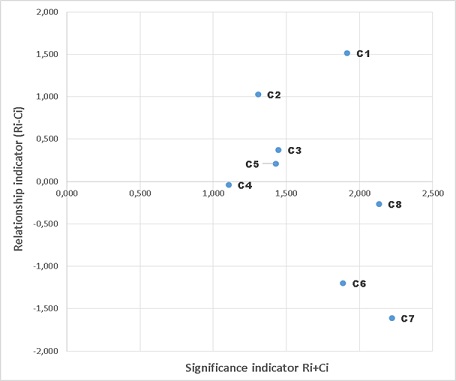
Figure 6: Causal diagram for criteria used for the land suitability assessment for maize.
The cause and effect diagram was obtained using the values of Di+Riand Di-Ri presented in (Table 6) above. As shown in (Figure 7), all evaluation criteria were divided into both cause and effect clusters. The effect cluster was comprised of C3, C4, C5, C6, C7 and C8 with negative values of (Ri − Di), whereas the cause cluster included C1 and C2 with (Di-Ri) positive values. It can also be seen that C1 was the highest causal factor followed by C2 while both C6 and C7 were the highest effect factors. In addition, C5, C7 and C8 were identified as the most important factors as they demonstrated high levels of interrelationship with the other factors.
Insert Fig.7. 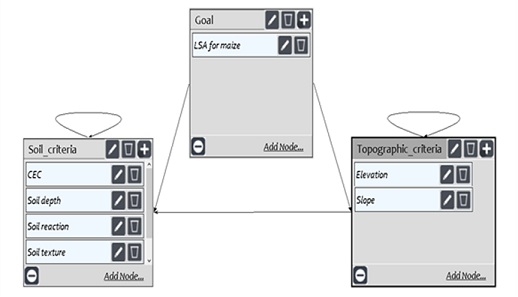
Figure 7: Decision network model of the ANP analysis.
ANP analysis
Once the interdependencies between the criteria were determined using the DEMATEL method, the ANP method was used to determine the final weight of the evaluation criteria. Within the framework of this study, the SuperDecision software was used to carry out all the stages of the ANP analysis until the weights of the criteria were obtained.
The first step in this software consisted in establishing the interdepencies between the different criteria and group of criteria based on the results of the DEMATEL analysis.Thus, the evaluation criteria were subdivided into two groups, namelythe soil criteria and topographic criteria which is self-influencing between them. Likewise within the same group, the criteria are self-influencing each other as it is shown in (Figure8) (Table 7).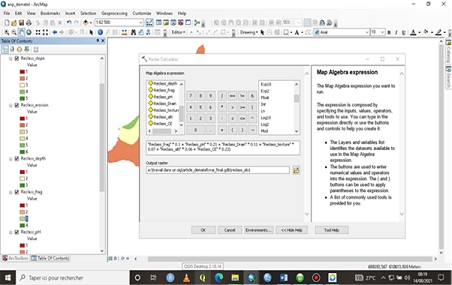 Figure 8: Weighted overlay analysis in ArcGIS 10.8
The second step was to complete the software questionnaire using the information collected from the experts (Figure 4). Once this questionnaire has been completed, the software performs all the necessary calculations and establishes the limited matrix from which the weights of the various criteria were extracted.
|
Criteria |
Weight |
Rank |
|
Topographycriteria |
||
|
Elevation |
0.191 |
3 |
|
Slope |
0.292 |
1 |
|
SoilCriteria |
||
|
Coarsefrag |
0.032 |
8 |
|
Soildepth |
0.061 |
6 |
|
Soil texture |
0.048 |
7 |
|
Soilreaction |
0.204 |
2 |
|
CEC clay |
0.076 |
5 |
|
Soil drainage |
0.095 |
4 |
Table 7: Criteria weight obtained from DEMATEL-ANP analysis
Land suitability assessment.
The suitable locations for the sustainable production of maize in Foumbot were determined using the DEMATEL-ANP-GIS algorithm.They were assessedusing the weighted overlay analysis of thematic maps (Figure 5) of evaluationcriteria in ArcGIS 10.8.
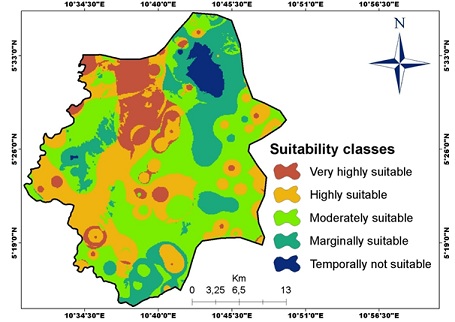 Figure 9: Land suitability classes for maize cultivation in Foumbot.
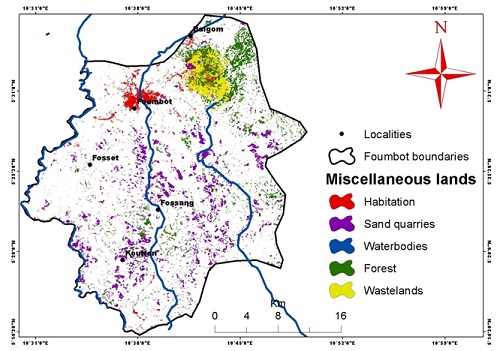 Figure 10: Miscellaneous land (non-agricultural land) of Foumbot.
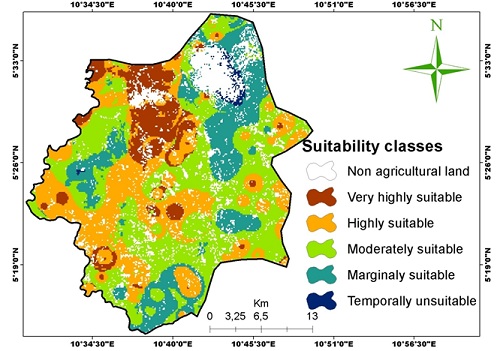 Figure 11: Agricultural land suitability classes for maize production in Foumbot
(Figure 11) represents the suitability map of Foumbotdistrictagricultural land for maize production after extracting the non-agricultural land (Figure 10) from the initial suitability map (Figure 9). It can be seen that the suitability classes vary from very highly suitable to temporarily unsuitable in the region.
Very highly suitable class (S1-0)
The very highly suitable class S1-0 involvesallthenortheastern part of the Foumbot district (Figure 11). This unit has suitable properties such as low elevation 100 m, no coarse fragments and a silty or sandy-clayey texture. From the point of view of chemical properties, the CEC in this unit varies from 16 to 24 cmolc + kg−1soil and the pH is between 5.6 and 5.8. These areas covered 11% of the total area of agricultural land in the district which represent 8056 ha (Table 8).
Highly suitable class (S1-1)
The lands of this unit are considered to be highly suitableforsustenaible maize production (Figure 11). This areaislocated around the previous class and extend to the southern partof the study area. It is more than twice as large as the previous unit as it covers 29% of the total area of agricultural land in the district which represent21119 ha (Table 8). It has analmost flat topography with slope rangingfrom 2 to 5%, and an altitude from 1100 to 1250 m. identically as the previous unit; it has a low concentration of coarse fragments (3 - 15%) and a good drainage. The soil texture is loamy or sandy clay loam and the soil depths vary from 75 to 100m (Table 3).
Moderate suitable class (S2)
The land unit with moderate suitability class S2 was identified as areas that are moderatelysuitablefor sustainable maize farming. It covers an area of 27,405 ha which represent 38% of the total area of agricultural land in the Foumbot district or 31212 ha which represent 37% of the total surface area of the Foumbot district (Table 8). In this unit, the slope varies between 5 and 8% and the elevation is less than 1400 m. The soils in this unit are more than 75 m deep and have a clayeysilty, silty, sandysilty, siltyclayey and clayey texture. Its chemical properties such as CEC vary between 8 and 24 cmolc + kg−1and pH between 5.2 - 5.6 (Table 3).
Marginally suitable class (S3)
This unit represents the boundary between the suitable and unsuitable zones (Figure 11). It covers 14422 ha which represents 20% of the total agricultural land area in the Foumbot or 17483 ha which represents 21% of the total surface area of Foumbot Sub division (Table 8) and surrounds the S2 class. It is characterized by a slope raging from 8 to16% and an elevation of less than 1650 m. The soils of this unit are very shallow in general with a depth ranging from 20 to 50 m and their drainage is marginal or even imperfect. They generally have a siltyclayey, clayey and clayloamy texture. The CEC of this unit varies between8 and 16 meq/100g and its pH between 5.2 and 5.5 (Table 3).
Currently unsuitable class (N1)
This unit is located on the steep slopes around the Mount Mbappit and covers an area of 606 ha or 1% of the total area of agricultural land in Foumbot or 2553 ha or 3% of the total area of interest. It is characterized by very steep slopes greater than 16% and an altitude between 1400 and 1800 (Figure 12). Despite this very uneven topography, the unit has soils with a depth of between 75 and 100 m with good to moderate drainage and a concentration of coarse elements greater than 15% (Table 3). The texture of the soils in this unit is identical to that of the previous unit. It has good chemical properties such as high CEC (CEC> 24 cmolc + kg−1) and the pH is between 5.2 and 5.8.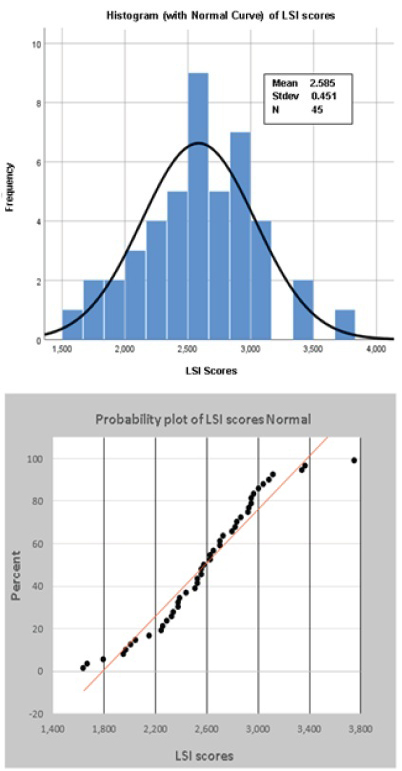 Figure 12: Histogram and normality graph of LSI scores.
|
|
Suitability area before deducting miscellaneous land* |
Suitabilty area after deducting miscellaneous land |
Miscellaneous land per suitability classes |
|||||
|
|
Ha |
% per total land |
Ha |
% per agricultural land |
% per total land |
Ha |
% per non agricultural land |
% per total land |
|
Very highly suitable |
9454 |
11 |
8056 |
11 |
85 |
1398 |
11 |
15 |
|
Highly suitable |
23699 |
28 |
21119 |
29 |
89 |
2580 |
20 |
11 |
|
Moderately suitable |
31212 |
37 |
27405 |
38 |
88 |
3807 |
30 |
12 |
|
Marginally suitable |
17483 |
21 |
14422 |
20 |
82 |
3061 |
24 |
18 |
|
Temporally unsuitable |
2553 |
3 |
606 |
1 |
24 |
1947 |
15 |
76 |
Table 8: Potential land area per suitability classes
* Miscellaneous lands = non agricultural lands.
Validation of suitability map
The error matrix presented in Table 9 was obtained by comparing the maize yields obtained in different land units over a period of three years and land suitability indixes obtained using the model.
|
|
|
Ground truth |
|
||||
|
|
|
S1-0 |
S1-1 |
S2 |
S3 |
N |
Total |
|
Predicted |
S1-0 |
6 |
1 |
0 |
0 |
0 |
7 |
|
S1-1 |
1 |
19 |
2 |
0 |
0 |
22 |
|
|
S2 |
0 |
2 |
20 |
3 |
0 |
25 |
|
|
S3 |
0 |
1 |
1 |
12 |
1 |
15 |
|
|
N |
0 |
0 |
0 |
1 |
5 |
6 |
|
|
|
Total |
7 |
23 |
23 |
16 |
6 |
75 |
Table 9 :Confusion/error matrix
The results of the kappa analysis using SPSS as shown in table 10 give a total overall accuracy of 78.67% and a kappa value of 0.7256 with an asymptotic error of 0.058. This value shows that the accuracy of the suitability map established is good according to [67].
|
|
S1-0 |
S1-1 |
S2 |
S3 |
N |
|
User’s accuracy |
83.33 |
86.36 |
76 |
73.33 |
71.42 |
|
Producer’s accuracy |
71.42 |
82.61 |
82.61 |
68.75 |
83.33 |
|
Overall accuracy |
78.67 |
||||
|
Degree of agreement Kappa |
72.56 |
||||
|
Asymptotic standard error |
0.058 |
||||
Table 10: Results of kappa statistics analysis
Discussion
This current research aims to integrate a hybrid MCDAmethod with GIS for LSA. An approach that integrates the DEMATEL and the ANP methods ispresented, and it showsthatit is a technique that allows the effective determination of the weight of the criteria that affect land suitability. It is an integrated strategic land suitability assessment framework that focuses on the degree of influence that exists between evaluation criteria [44]. In this approach, the DEMATEL analysis established the interdependence between evaluation criteria based on the subjective judgments of experts and the ANP is used to determine the weight and prioritization of each evaluation criterion [47].This DEMATEL-ANP approach involves careful selection and standardization of evaluation criteria and weighting procedures using objective methods that determine the weights of criteria by solving mathematical models [45].
In this study, eight (8) criteria (pH, slope, elevation, CEC, texture, coarse fragments, soil depth and soil drainage) were used. This is in line with many studies [4, 51-53]that have been conducted around the worldonland suitability assessment of for maize cultivation.Indeed, [52] and [4] used slope, elevation, pH and texture to evaluate land suitability for maize cultivation in a Semi-Arid region of Iran. [51] used, in addition to others variables, CEC, coarse fragments and drainage. It is observed that these factors are common to all these studies because they affect most the suitability of land for maize cultivation. According to [7], soil drainage greatly influences aeration in the rooting zone, and the degree of aeration greatly influences several important biochemical reactions of economic importance to crop production. Excess water in the crop rooting zone soil is injurious to plant growth. Crop yields are drastically reduced on poorly drained soils, and, in cases of prolonged waterlogging, plants eventually die due to a lack of oxygen in the root zone [68].As for the slope, it indirectly limits agricultural production by affecting soil properties negatively and directly by restricting the possibility of using machines and management applications such as soil tillage, irrigation and drainage [69].According to [15], soil reaction provides the information about availability of nutrients and phyto-toxicity as well as the suitability of land for specific crops. [74], observedthat maize crops grow best at a soil pH range of 5.5 and 7.3, with pH 6.0–6.5 being optimalasnitrogen, potassium, phosphorus, calcium and magnesium are readily available at such pH range.
Results of DEMATEL-ANP analysis demonstrate that topographic factors influence the suitability of Foumbot agricultural land for maize production more than factors related to soil physico-chemical properties. Indeed, the highest weight was assigned to the slope (0.292) followed by pH (0.204), elevation (0.191) and soil drainage (0.095). Thus the slope is the most limiting factor for maize production in Foumbot since more than 30% of the total surface area has a slope degree greater than 16%. These results reflect the reality and are confirmed by experts since Foumbot soils are developed on volcanic ash and are therefore potentially chemicaalyfertile (Table 3). The good results of DEMATEL-ANP analysis emphasized the better performance of the hybrid model as it was the case with the results obtained by [44] who compared the ANP and DEMATEL-ANP methods in a study on site selection for the installation of a wind power plant.They observed that the weight and priorities of the criteria obtained by the two methods differ significantly.ANP established relationships regardless of strength, thus criteria with weak relations were paired with others in the comparison process. This means that the overall weight obtained from this method is not properly distributed among the criteria. [46], also recommend the use of this method after testing its effectiveness in a study that also focused on the selection of sites for the installation of a wind power plant in Serbia.DEMATEL-ANP method is a very useful in any field that needs considering many dimensions and criteria [70].Application of GIS-DEMATEL-ANP combination techniques in environmental studies can prepare a simultaneous explanation of geographical data and environmental factors [46]. In current research, multidimensional data layers have been integrated into one-dimensional scales for priority assessment of suitable site for sustainable maize production. GIS and DEMATEL-ANP applied in current research can improve Manager’s and Planner’s performance for spatial assessment procedures by preparing all dimensions on the basis of a collection of assessment criteria.
The GIS- DEMATEL-DEMATEL-ANP algorithm helps decision-makers to select suitable lands based on a set of criteria related to the biophysical environment [45]. GIS-MCDM is a fast and cost-effective technique for LSA purposes, especially in the initial stages of land use planning [71]. In this stage, planners, stakeholders and experts partner to improve the process of identifying land suitable for agricultural production. Different ideas indicate the effectiveness of GIS-DEMATEL-ANP can rapidly aggregate this new opinion into the locating procedure [72]. The current algorithm, used in this research to determine suitable sites for aquaculture in Lorestan province can be quickly changed to identify aquaculture sites for different areas in Iran.
Many types of research have indicated that integrating GIS and DEMATEL-ANP is an executive algorithm for ranking planning decisions in many felds. [44], used the GIS-DEMATEL-ANP approach in a spatial assessment to help locating suitable sites in Ardabil province, Iran. [45],assessed the effectiveness of the aggregation ofGIS and DANP in Tehran city, Iran. Another study drawn by [46] investigated the integration of GIS and DEMATEL-ANP in an assessment on criteria for locating suitable site procedures in Vojvodina province, Serbia. [70], indicated the combination of an executive procedure with GIS-based DEMATEL-ANP for suitable site selection in China.[47], assessed suitability of land (LSA) for aquaculture site selection via an integrated GIS-DEMATEL-ANP multi-criteria method. The current research prepares an executive method toward the integration of GIS and DEMATEL-ANP in agricultural field.
Conclusion
The suitability map of agricultural land in the Foumbot district was established during this study using an integrated approach combining the DEMATEL and ANP multi-criteria decision-making methods in a GIS environment. The DEMATEL-ANP combination was introduced to evaluate the level of influence of each evaluation criterion on the final suitability of the Foumbotland for maize cultivation, while highlighting the interaction between them. The DEMATEL analysis in this study has established the interdependence between the eight (8) evaluation criteria. Thus, slope, elevation, coarse fragments and texture revealed positive influence vectors (Ri-Di), which means that they have a strong influence over the other criteria in maize production in this locality. In addition, pH, CEC and soil drainage are the criteria that interact the most with the others because their relationship vectors (Ri+Di) values are the highest. Once the interdependence was established between the evaluation criteria, the experts filled in a questionnaire defining the level of influence between the criteria that were established to have interactions between them by theDEMATEL analysis. Thus, the ANP was used to determine the weight and prioritization of each evaluation criterion. From this analysis, it appears that slope and elevation are the criteria that affect the most the suitability of Foumbot's agricultural land for maize cultivation. In fact, from the point of view of physico-chemical properties, the soils of the Foumbot district are not very constraining and can be well suited to maize cultivation.The initial land suitability map was created using a “Map algebra expression” by assigning a given weight to each criterion, and the final suitability map of the study area for maize production was generated after extracting non agricultural land from the initial suitability map. The results show that almost all, or 99%, of foumbot's agricultural land is suitable for maize production. But this suitability varies from very highly to marginally suutable. Furthermore, 8056 ha or 11% are very highly suitable, 21119 ha or 29% are very highly suitable, 38% or 27405 ha are moderately suitable and 20% or 14422 ha are marginally suitable. The remaining 1% that falls under non suitable classe represents 606 ha. The kappa analyis to access the accuracy of the established suitability map gives a total overall accuracy of 78.67% and a kappa value of 0.7256 with an asymptotic error of 0.058. The value of the kappa coefficient obtained shows that the accuracy of the suitability map was good and could be used for futher decision making processes.This study contributes to the literature by extending the practical applications of the DEMATEL-ANP method in land suitability assessment. The combination of ANP and DEMATEL provides compelling results in strategic decision making. It should be noted that there is no similar research in Central Africa using this methodology. Therefore, this should be tested in other ecosystems.
Author Contributions
Conceptualization, L.J.; formal analysis, L.J., S.H., K.S., and K.W.; writing—
original draft preparation, Bertrand Kenzong; writing, review and editing, Bertrand Kenzong, DieudonnéBitondo, Primus AZINWI TAMFUH, Georges Simplice KOUEDEU KAMENI, Joseph GUEPI VOUNANG, Roger Kogge ENANG, Emile TEMGOUA and Dieudonné BITOM visualization, L.J. and K.S.; project administration, W.S. All authors have read and agreed to the published version of the manuscript.
Conflict of interests
The authors declare that they have no conflict of interest. Availability of data and material -All data are fully available without restriction.
References
- MbodiamBR (2022) Maïs : chaque année, le Cameroun exporte en moyenne 500 000 tonnes de sa production vers les pays de la zone Cemac. Investir au Cameroun
- EpuleTE, Bryant CR (2015) Maize Production Responsiveness to Land Use Change and Climate Trends in Cameroon. Sustainability, 7:384-397.
- Baroudy AAE (2016) Mapping and evaluating land suitability using a GIS-based model. Catena 140:96–104.
- Tashayo B, HonarbakhshA, AkbariM, EftekhariM (2020) Land suitability assessment for maize farming using a GIS-AHP method for a semi- arid region, Iran, Journal of the Saudi Society of Agricultural Sciences, 19:332-338.
- Bandyopadhyay S, Jaiswal RK, Hegde VS, Jayaraman V (2009) Assessment of land suitability potentials for agriculture using a remote sensing and GIS based approach. International Journal of Remote Sensing 30:879–895.
- Mokarram M,Aminzadeh F(2010) GIS-based multicriteria land suitability evaluation using ordered weight averaging with fuzzy quantifier: a case study in Shavur Plain, Iran. The International Archives of the Photogrammetry, Remote Sensing and Spatial Information Sciences 38:508–512.
- Akinci H, Özalp AY, Turgut B (2013) Agricultural land use suitability analysis using GIS and AHP technique. Computers and Electronics in Agriculture 97:71–82.
- DucTT (2006) Using GIS and AHP technique for land-use suitability analysis. In: International Symposium on Geoinformatics for Spatial Infrastructure Development in Earth and Allied Sciences 9–11.
- Ngandeu MJD, Yimefack M, Youngue-Fouateu R, Bilong P(2008) Variabilité spatiale de la productivité d’un Andosol Leptique de la région de Foumbot, Ouest Cameroun. ÉtudeetGestion des Sols, 15:87-96.
- Tsozué D, Azinwi PT, Ndaka SMB (2015) Morphology, Physicochemical Characteristics and Land Suitability in the Western Highlands of Cameroon. International Journal of Plant & Soil Science 7:29-44.
- Enang RK, Yerima BPK, Kome GK (2016) Soil physico-chemical properties and land suitability evaluation for maize (Zea mays), beans (Phaseolus vulgaris) and Irish potatoes (Solanumtuberosum) in tephra soils of the western slopes of mount Kupe (Cameroon). Afr. J. Agric. Res, 11:4571-4583.
- AzinwiTamfuh P, Temgoua E, Wotchoko P, Boukong A, Bitom D (2018) Soil Properties and Land Capability Evaluation in a Mountainous Ecosystem of North-West Cameroon. Journal of Geoscience and Environment Protection, 6:15-33.
- Kome GK, Tabi FO, Enang RK, Silatsa FBT (2020) Land Suitability Evaluation for Oil Palm (ElaeisguineensisJacq.) in Coastal Plains of Southwest Cameroon. Open Journal of Soil Science, 10:257-273.
- Sarmadian F, Keshavarzi A, Rajabpour B, Askari S(2010) Application of MCDM method in Fuzzy Modeling of Land Suitability Evaluation. 19th World Congress of Soil Science, Soil Solutions for a Changing World 1 – 6.
- Mustafa AA, Singh M, Sahoo RN, Ahmed N, Khanna M, Sarangi A, et al. (2011) Land Suitability Analysis for Different Crops: A Multi Criteria Decision Making Approach using Remote Sensing and GIS. Researcher, 3:61-84.
- Zabihi H, Ahmad A, Vogeler I, Said MN, Golmohammadi M, et al. (2015) Land suitability procedure for sustainable citrus planning using the application of the analytical network process approach and GIS. Computers and Electronics in Agriculture 117:114–126.
- Seyedmohammadia J, Sarmadian F, Jafarzadeha AA, GhorbanicMA, Shahbazi F (2018) Application of SAW, TOPSIS and fuzzy TOPSIS models in cultivation priority planning for maize, rapeseed and soybean crops. Geoderma, 310:78–190.
- Herzberg R, Pham TG, Kappas M, Wyss D, Tran CTM (2019) Multi-Criteria Decision Analysis for the Land Evaluation of Potential Agricultural Land Use Types in a Hilly Area of Central Vietnam. Land, 8:90.
- Orhan O (2021) Land suitability determination for citrus cultivation using a GIS-based multi-criteria analysis in Mersin, Turkey. Computers and Electronics in Agriculture 190:106433.
- Mugiyo H, ChimonyoVGP, Sibanda M, Kunz R, Masemola CR, et al. (2021) Evaluation of Land Suitability Methods with Reference to Neglected and Underutilised Crop Species: A Scoping Review. Land, 10: 125.
- Malczewski J (2006) GIS-based Multicriteria Decision Analysis: A Survey of the Literature. International Journal of Geographical Information Science 20:703–726.
- Mendas A, Delali A(2012) Integration of MultiCriteria decision analysis in GIS to develop land suitability for agriculture: application to durum wheat cultivation in the region of Mleta in Algeria. Comput. Electron. Agric. 83:117–126.
- Nguyen TT, Verdoodt A, Tran VY, Delbecque N, Tran TC, et all. (2015) Design of a GIS and multi-criteria-based land evaluation procedure for sustainable land-use planning at the regional level. Agriculture, Ecosystems and Environment, 200:1–11.
- Ngandam AHM, Ngouyamsa RBM, Ngùet PW, Gbetkom PG, Ntengo M(2019) Modelling Best Oil Palm Site Planting in Njimom, West-Cameroon: A GIS-Analysis Combining Weighted Linear Combination, Fuzzy Analytical Hierarchy Process and Utility Function. Journal of Geographic Information System, 11:138-165.
- Ramamurthy V, Obi Reddy GP, Kumar N (2020) Assessment of land suitability for maize (Zea mays L) in semi-arid ecosystem of southern India using integrated AHP and GIS approach. Computers and Electronics in Agriculture 179:105806.
- Schulze-González E, Pastor-Ferrando JP, AragonésBeltrán P (2021) Testing a Recent DEMATEL-Based Proposal to Simplify the Use of ANP. Mathematics, 9:1605.
- Sipahi S, Timor M (2010)The analytic hierarchy process and analytic network process: an overview of applications. Management Decision, 48:775-808.
- Yohannes H, Soromessa T (2018) Land suitability assessment for major crops by using GIS-based multi-criteria approach in AnditTid watershed, Ethiopia, Cogent Food & Agriculture, 4:1470481.
- Gölcük I, Baykasoglu A (2015)An analysis of DEMATEL approaches for criteria interaction handling within ANP, Expert Systems with Applications, 46:346-366.
- Gabus A, Fontela E(1972) World Problems, an Invitation to Further Thought within the Framework of DEMATEL; Battelle Geneva Research Center: Geneva, Switzerland.
- Si SL, You XY, Liu HC, Zhang P (2018) DEMATEL Technique: A Systematic Review of the State-of-the-Art Literature on Methodologies and Applications. Mathematical Problems in Engineering, 1-33.
- Awang A, Aizam NAH, Abdullah L(2019) An Integrated Decision-Making Method Based on Neutrosophic Numbers for Investigating Factors of Coastal Erosion. Symmetry, 11:328.
- Saaty TL (1996) Decision making with dependence and feedback, the analytic network process. RWS Publications, 4922 Ellsworth Ave., Pittsburgh, 370p.
- Yang JL, Tzeng GH(2011) An integrated MCDM technique combined with DEMATEL for a novel cluster-weighted with ANP method. Expert Systems with Applications, 38:1417–1424.
- Kheybari S, Rezaie FM, Farazmand H (2020) Analytic network process: An overview of applications. Applied Mathematics and Computation, 367:124780.
- Tseng ML (2009) Application of ANP and DEMATEL to evaluate the decision-making of municipal solid waste management in Metro Manila. Environmental Monitoring and Assessment, 156:181–197.
- Tsai WH, Chou WC (2009) Selecting management systems for sustainable development in SMEs: a novel hybrid model based on DEMATEL, ANP, and ZOGP. Expert Systems with Applications, 36:1444–1458.
- Büyüközkan G,Güleryüz S(2016)An integrated DEMATEL-ANP approach for renewable energy resources selection in Turkey. Int. J. Production Economics.
- Dehdasht G, Zin RM, Ferwati MS, Abdullahi MM, Keyvanfar A, et al. (2017) DEMATEL-ANP Risk Assessment in Oil and Gas Construction Projects. Sustainability, 9:1420.
- Kadoic N, Divjak B, Redep NB(2018) Integrating the DEMATEL with the analytic network process for effective decision-making. Central European Journal of Operations Research.
- Wu CH, Tsai SB (2018) Using DEMATEL-Based ANP Model to Measure the Successful Factors of E-Commerce. Journal of Global Information Management, 26:120-135.
- Zhu X, Yan R, Xu TX(2020) An Integrated DEMATEL-ANP Approach for Mobile Banking Adoptions in China Market. Discrete Dynamics in Nature and Society, 1-19.
- Pourkhabbaz HR, Javanmardi S, Yavari AR, Sabokbar HF(2013) Application of Multi Criteria Decision Making Method and the Integrated ANP- DEMATEL Model for Agricultural Land Suitability Analysis (Case study: Qazvin Plain). Journal of Environmental Studies, 39:34-36.
- Azizi A, Malekmohammadi B, Jafari HR, Nasiri H, Parsa VA (2014) Land suitability assessment for wind power plant site selection using ANP-DEMATEL in a GIS environment: case study of Ardabil province, Iran. Environmental Monitoring and Assessment.
- Pourahmad A, Hosseini A, Banaitis A, Nasiri H, Banaitiene N, et al.(2015) Combination of fuzzy-AHP and DEMATEL-ANP with GIS in a new hybrid MCDM model used for the selection of the best space for leisure in a blighted urban site, Technological and Economic Development of Economy, 21:773-796.
- Gigovic L, Pamucar D, Božanic D, Ljubojevic S(2017) Application of the GIS-DANP-MABAC multi criteria model for selecting the location of wind farms: A case study of vojvodina, Serbia. Renew. Energy 103:50–521.
- Ghobadia M, Nasria M, Ahmadipari M(2021) Land suitability assessment (LSA) for aquaculture site selection via an integrated GIS-DANP multi-criteria method; a case study of lorestan province, Iran.
- Ngandeu MJD, Yimefack M, Youngue-Fouateu R, Bilong P(2016)Erodibility of cultivated soil in Foumbot area (West Cameroon). TROPICULTURA, 34:276-285.
- Wandji P(1985) Contribution à l’étude pétrologique, géochimique et géotechnique des projections volcaniques de la région de Foumbot. Thèse doct. 3e cycle, Université de Yaoundé.
- Commune de Foumbot(2019) Plan communal de Développement de Foumbot. Groupement d’Appui pour le Développement Durable (GADD).
- Abagyeh SOI, Idoga S, Agber PI (2016) Land suitability evaluation for maize (Zea mays) production in selected sites of the Mid-Benue valley, Nigeria. Int. J. Agric. Pol. and Res,4:46-51.
- Pilevar AR, Matinfar HR, Sohrabi A,Sarmadian F (2020) Integrated fuzzy, AHP and GIS techniques for land suitability assessment in semi-arid regions for wheat and maize farming. Ecological Indicators, 110: 105887.
- Habibie MI, Noguchi R, Shusuke M, Ahamed T (2019) Land suitability analysis for maize production in Indonesia using satellite remote sensing and GIS-based multicriteria decision support system. GeoJournal, 86:777-807.
- Pauwels JM, VanRanst E, Verloo M, MvondoZe A (1992) Manuel de Laboratoiredepedologie.
- Walkley AJ, Black IA (1934) Estimation of soil organic carbon by the chromic acid titration method. Soil Sci. 37:29-38.
- Bray RH, Kurtz LT (1945) Determination of Total Organic and Available Forms of Phosphorus in Soils. Soil Science, 59:39-45.
- Soil Survey Staff (1996) Soil survey laboratory methods manual. Version No. 3.0. USDA-. NRCS. Soil Survey Investigations Report No. 42. U.S. Govt. Print.
- Bouyoucos GJ (1962) Hydrometer method improved for making particle size analysis of soils. Agronomy Journal 54:464-465.
- Voogd H (1983) Multicriteria Evaluation for Urban and Regional Planning. Pion Ltd., London, 367p.
- Malczewski J (2004) GIS-based Land-use Suitability Analysis: A Critical Overview.” Progress in Planning 62:3–65.
- Sarkar A, Ghosh A,Banik P (2014) Multi-criteria land evaluation for suitability analysis of wheat: a case study of a watershed in eastern plateau region, India, Geospatial Information Science, 17:119-128.
- Jayasinghe SL, Kumar L, Sandamali J(2019) Assessment of Potential Land Suitability for Tea (Camellia sinensis (L.) O. Kuntze) in Sri Lanka Using a GIS-Based Multi-Criteria Approach. Agriculture, 9:148.
- Adams W, Saaty R(2003) Super Decisions Software Guide. Super Decisions, 9.
- Zolekar RB, Bhagat VS (2015) Multi-criteria land suitability analysis for agriculture in hilly zone: Remote sensing and GIS approach. Comput. Electron. Agric. 118:300–321.
- Bergeri I, Michel R,Boutin J P (2014). Pour savoir ou Presque sur le coefficient Kappa. MédecineTropicale, 62:634-636.
- Wilding LP (1985) Spatial variability its documentation, accommodation and implication to soil survey, 166-194. In D, Nielsen R,BoumaJ (eds.). Soil Spatial Variability, Pudoc, Wagenigen, the Netherlands.
- Landis JR, Koch GG (1977) The Measurement of Observer Agreement for Categorical Data. International Biometric Society,33:159-74.
- Wells KL (1980) Soil drainage-Effect on crop production. Soil science news and views. 152.
- Koulouri M,Giourga C (2007) Land abandonment and slope gradient as key factor of soil erosion in Mediterranean terraced lands. Catena, 69:274-281.
- Shao QG, Liou JJH, Weng SS, Chuang YC (2018) Improving the green building evaluation system in China based on the DANP method. Sustainability 10:1173–1193.
- Ramadhini M,Sihombing AR (2018) Utilization of geographic information system (GIS) in determining the suitability of fsheries locations cultivation of freshwater fish ponds in South Aceh regency. JurnalInotera 3:81–86.
- Kanani-Sadat Y, Arabsheibani R, Karimipour F, Nasseri M (2019) A new approach to flood susceptibility assessment in data-scarce and ungauged regions based on GISbased hybrid multi criteria decision-making method. J. Hydrol. 572:17–31.
- FAO (1976) A framework for land evaluation (Soils Bulletin No. 32). Rome: Food and Agriculture Organization of the United Nations.
- Seyedmohammadia J, Sarmadianb F, Jafarzadeha AA, McDowell RW(2019) Development of a model using matter element, AHP and GIS techniques to assess the suitability of land for agriculture. Geoderma 352:80–95.
Citation: Kenzong B, Bitondo D, tamfuhPA, Kameni GSK, vounang JG. et al (2022) Land Suitability Assessment for Maize (Zea mays L) Production using Integrated DEMATEL-ANP Model and GIS in the Foumbot Agricultural Basin (Cameroon Western Highlands). J Agron Agri Sci 5: 30.
Copyright: © 2022 Dieudonné Bitom, et al. This is an open-access article distributed under the terms of the Creative Commons Attribution License, which permits unrestricted use, distribution, and reproduction in any medium, provided the original author and source are credited.