Lung Cancer Survival by Stage of Cases Diagnosed in Mallorca, Spain, Between 2006 and 2011 and Factors Associated With Survival
*Corresponding Author(s):
Maria RamosDepartment Of Public Health, Balearic Department Of Health, Palma, Spain
Tel:+34 971177386,
Email:mramos@dgsanita.caib.es
Abstract
1) To determine survival of lung cancer by stage; 2) To identify factors that explain and predict the likelihood of survival and the risk of dying from this cancer and 3) To find out the distribution of lung cancer cases by stage.
Methodology
Retrospective follow-up study of people diagnosed with invasive lung cancer during 2006-2011, identified through the Mallorca Cancer Registry. Cases ascertained only by death certificate and lymphomas were excluded. Sex, age, diagnostic method, histology, T, N, M, and stage, date of diagnosis, date of follow-up or death, and cause of death were collected. End point of follow-up was 31st December 2013. Multiple Imputation (MI) method was performed to obtain stage when unknown. Actuarial and Kaplan-Meier methods were used for survival analysis. Extended Cox models were built to identify factors that explain and predict survival.
Results
A total of 2,576 lung cancer cases were diagnosed, 18.8% in women, with a mean age of 66 years. Survival by stage at 5 years after diagnosis was 46% at stage IA, 40% at stage IB, 45% at stage IIA, 22% at stage IIB, 16% at stage IIIA, 7% at stage IIIB, and 3% at stage IV, 5 years after diagnosis. Women, younger cases, patients with adenocarcinoma, and patients diagnosed in IA, IB and IIA stages had a better prognosis.
Conclusion
Lung cancer survival was similar for IA, IB and IIA stages, but worsened remarkably in more advanced stages. It was also influenced by age, sex, and histology.
INTRODUCTION
Lung cancer survival remains poor worldwide, as shown by CONCORD-2 [4], with 5-year survival below 20% everywhere in Europe, in the range of 15-19% in North America and less than 10% in some East Europa, Asia and African countries. According to EUROCARE-5 [5], European lung cancer age-standardized 5-years relative survival for cases diagnosed 2000-2007 was 13.0 (12.9-13.1) and small geographical differences were observed, varying from 9.0% (8.8-9.1) in the UK and Ireland to 14.8% (14.6-14.9) in central Europe. In Spain, 5-years relative survival was 10.7 (10.2-11.2), almost five points higher in women [14.7 (13.1-16.6)] compared to men [10.1 (9.5-10.6)]. Differences among Spanish regions were explored from EUROCARE-4 data, and it was observed that Navarra had twice the rate of Granada [12.4 (10.3-144.6) with respect to 6.1 (4.8-7.6)] [6].
In Europe, there are only a few reports about lung cancer that include survival rates by stage [7-9], none following the UICC TNM Classification 7th edition, that classifies lung cancer in 7 categories and includes small cell lung cancers [10]. The percentage of cases with unknown stage in these studies was not negligible: 23% in Ireland [7] or 12% in Northern Italy [8], potentially weakening the validity of the results. In these situations, multiple imputation is an alternative and valid method to deal with missing values [11], as shown in some studies [9]. In Spain, population-based cancer registries do not normally collect information about stage as a standard procedure but the Mallorca Cancer Registry has done so since 2006 [10]. In addition to stage; the sex, age and histology, as well as molecular status [12], smoking status, treatment and deprivation [7,13], are all significant factors that determine survival [7,8,14].
The aims of the present study were: 1) to determine lung cancer survival by stage; 2) to identify factors that explain and predict the likelihood of survival, and the risk of dying from this cancer and, incidentally: 3) to find out the distribution of lung cancer cases by stage according UICC TNM Classification 7th edition.
METHODS
Study Population
As well as the topography and histology according to ICD-O 3rd edition1 [15], data on: sex, age, site and sub-site, date of diagnosis, diagnostic method (clinical or pathological), pathological or clinical Tumour size (T), pathological or clinical regional lymph Nodes (N), Metastasis (M), stage, date of last follow-up or date of death, and cause of death (lung cancer or other causes) were also collected.
Age was recorded as: 15-44 years old, 45-54, 55-64, 65-74, and 75 and over. Site and sub-site were recorded as: main bronchus, upper lobe, bronchus or lung, middle lobe, bronchus or lung, lower lobe, bronchus or lung and overlapping sites of bronchus and lung. Histology was recorded by modifying Parkin groups [16]: adenocarcinoma (8140, 8211, 8323, from 8230 to 8231, from 8250 to 8260, from 8480 to 8490, from 8550 to 8560, from 8570 to 8574), squamous carcinoma (from 8050 to 8076), small cell carcinoma (from 8041 to 8045), and others/unspecified (8082, 8190, 8290, 8310, 8046, 8320, 8430, 8500, 8510, 8562, 8580, 8693, 8720, 8730, from 8141 to 8143, from 8200 to 8201, from 8240 to 8241, from 8244 to 8246, from 8470 to 8471, from 8012 to 8031, from 8010 to 8011, from 8032 to 8034, from 8000 to 8004 and from 8800 and above).
Stage was calculated according to the UICC TNM Classification 7th edition: IA, IB, IIA, IIB, IIIA, IIIB and IV [15]. Pathological T (pT) or N (pN) was prioritised over clinical, except when neo-adjuvant therapies had been applied. An integrated approach [17] was used by combining pathological and clinical components to obtain the stage. An in-depth review of clinical case records with missing values for T, N or M, as well as cases without follow-up was performed.
Time was calculated from date of diagnosis to date of death or date of last follow-up. Vital status refers to the state (alive (0) or dead from lung cancer (1) or from other causes (2)) at the time of the last follow-up. Deaths from other causes were censored, as well as cases that emigrated from Mallorca, or lost cases. The starting point of follow-up was the date of diagnosis, and the end point was 31st December 2013.
Statistical Analysis
Survival analysis was developed by actuarial and Kaplan-Meier methods to estimate likelihood of survival and risk of death, the Log-Rank test to assess the statistical differences of the observed survival curves by each categorical variable, and the Cox regression models to identify prognostic factors of the risk of death. In this case, age was considered as a continuous variable because our interest was to know the effect of each unit increase on the risk of dying from lung cancer. The proportional hazard assumption for each covariate was tested by introducing time-dependent variables. Since some of the covariates, age and histology, did not meet this assumption, the standard Cox model could not be used, as the effect of these variables on the risk of death was time-dependent, and they could not be introduced in the model. Therefore, we applied the extended Cox regression which, in addition to analysing the effect of covariates on the risk of dying, also allows modelling the time dependent effect of age and histology covariates. To do this, we introduce time-dependent variables in the model. To compare the effect of the imputation procedure on the hazard ratio estimation of covariates, the extended Cox regression was performed before and after MI. Finally, MI was carried out with STATA 13, and survival analysis with SPSS 20.
RESULTS
| Variable | Categories | Number | % | % valid* | After MI |
| Sex | Women | 484 | 18.8 | 18.8 | |
| Men | 2,092 | 81.2 | 81.2 | ||
| Age | 15-44 | 79 | 3.1 | 3.1 | |
| 45-54 | 356 | 13.8 | 13.8 | ||
| 55-64 | 704 | 27.3 | 27.3 | ||
| 65-74 | 740 | 28.7 | 28.7 | ||
| 75 or + | 697 | 27.1 | 27.1 | ||
| Method | Pathologic | 2,322 | 90.1 | 90.1 | |
| Clinic | 254 | 9.9 | 9.9 | ||
| Site | Main bronchus | 216 | 8.4 | 8.4 | |
| Upper lobe, bronchus or lung | 973 | 37.8 | 37.8 | ||
| Middle lobe, bronchus or lung | 78 | 3.0 | 3.0 | ||
| Lower lobe, bronchus or lung | 415 | 16.1 | 16.1 | ||
| Overlapping sites | 103 | 4.0 | 4.0 | ||
| Unspecified | 791 | 30.7 | 30.7 | ||
| Histology | Adenocarcinoma | 927 | 36.0 | 36.0 | |
| Small cell carcinoma | 366 | 14.2 | 14.2 | ||
| Squamouscell carcinoma | 602 | 23.4 | 23.4 | ||
| Other histology and unspecified | 681 | 26.4 | 26.4 | ||
| T | 1 | 184 | 7.1 | 13.9 | |
| 2 | 402 | 15.6 | 30.3 | ||
| 3 | 256 | 9.9 | 19.3 | ||
| 4 | 486 | 18.9 | 36.6 | ||
| Missing | 1,248 | 48.4 | |||
| N | 0 | 406 | 15.8 | 39.6 | |
| 1 | 164 | 6.4 | 16.0 | ||
| 2 | 454 | 17.6 | 44.3 | ||
| Missing | 1,552 | 60.2 | |||
| M | 0 | 804 | 31.2 | 37.9 | |
| 1 | 1,317 | 51.1 | 62.1 | ||
| Missing | 455 | 17.7 | |||
| Stage | IA | 113 | 4.4 | 5.0 | 5.0 |
| IB | 116 | 4.5 | 5.2 | 5.1 | |
| IIA | 65 | 2.5 | 2.9 | 2.9 | |
| IIB | 68 | 2.6 | 3.0 | 3.1 | |
| IIIA | 236 | 9.2 | 10.5 | 10.4 | |
| IIIB | 249 | 9.7 | 11.1 | 10.9 | |
| IV | 1,399 | 54.3 | 62.3 | 62.6 | |
| Missing | 330 | 12.8 | |||
| Vital status at the end of follow-up | Alive | 315 | 12.2 | 12.2 | |
| Death for lung cancer | 2,209 | 85.8 | 85.8 | ||
| Death for other causes | 52 | 2.0 | 2.0 |
*After excluding missing values
Median time of survival was 209 days, and in absolute terms only 316 patients survived until the end of the study. 1 year after diagnosis, survival was 36%, 3 years after diagnosis it was 15%, and 5 years after diagnosis, survival was 11%. Survival rates at 5 years after diagnosis were 47% for stage I, 35% for stage II, 11% for stage III, and 1% for stage IV. As it is shown in table 2, survival rates by stage per year changed before and after MI, being slightly overestimated in the early stages and underestimated in the advanced stages in the original data set.
| Original Data Set N = 2,246 | ||||||||
| Year | Stage IA | Stage IB | Stage IIA | Stage IIB | Stage IIIA | Stage IIIB | Stage IV | Total |
| 1 | 0.83 | 0.76 | 0.75 | 0.60 | 0.57 | 0.44 | 0.20 | 0.36 |
| 2 | 0.75 | 0.64 | 0.62 | 0.41 | 0.31 | 0.18 | 0.07 | 0.20 |
| 3 | 0.68 | 0.57 | 0.54 | 0.34 | 0.23 | 0.10 | 0.03 | 0.15 |
| 4 | 0.56 | 0.54 | 0.49 | 0.30 | 0.20 | 0.07 | 0.01 | 0.12 |
| 5 | 0.51 | 0.44 | 0.49 | 0.24 | 0.17 | 0.06 | 0.01 | 0.11 |
| 6 | 0.48 | 0.44 | 0.49 | 0.14 | 0.15 | 0.05 | 0.01 | 0.09 |
| 7 | 0.42 | 0.44 | 0.41 | 0.07 | 0.15 | 0.05 | 0.01 | 0.08 |
| 8 | 0.42 | 0.44 | 0.41 | - | 0.05 | - | 0.01 | 0.07 |
| MI Data Set N = 2,576 | ||||||||
| 1 | 0.78 | 0.74 | 0.72 | 0.58 | 0.55 | 0.43 | 0.23 | 0.36 |
| 2 | 0.69 | 0.60 | 0.59 | 0.39 | 0.30 | 0.19 | 0.09 | 0.20 |
| 3 | 0.62 | 0.53 | 0.51 | 0.33 | 0.22 | 0.11 | 0.05 | 0.15 |
| 4 | 0.51 | 0.50 | 0.46 | 0.28 | 0.19 | 0.08 | 0.03 | 0.12 |
| 5 | 0.46 | 0.40 | 0.45 | 0.22 | 0.16 | 0.07 | 0.03 | 0.11 |
| 6 | 0.43 | 0.40 | 0.45 | 0.13 | 0.14 | 0.05 | 0.02 | 0.09 |
| 7 | 0.38 | 0.40 | 0.38 | 0.07 | 0.14 | 0.05 | 0.02 | 0.08 |
| 8 | 0.38 | 0.40 | 0.38 | 0.07 | 0.05 | 0.05 | 0.02 | 0.07 |
Survival curves showed differences in lung cancer survival by age (P < 0.001), sex (P < 0.001), histology (P < 0.001) and method of diagnosis (P<0.001) (Figure 1). Comparing each variable by pair of categories, no differences in survival were found between ages 15-44, 45-54, 55-64 (P > 0.5). There were also no differences between stage IA, stage IB and stage IIA (P > 0.5) or finally between stage IIB and IIIA (P = 0.086) (Figure 2).
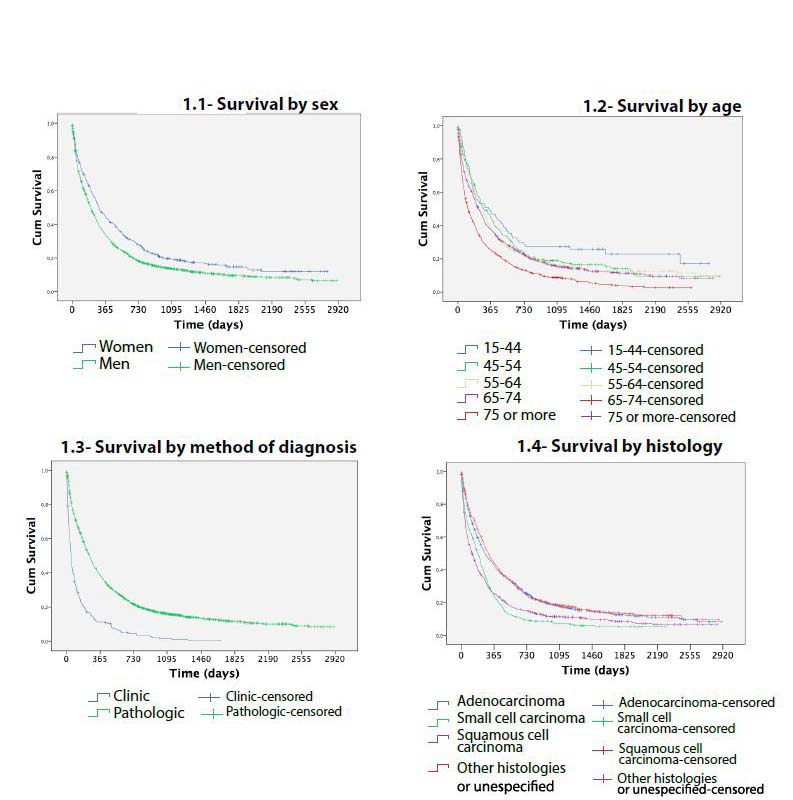 Figure 1: Survival of lung cancer cases diagnosed in Mallorca between 2006-2011 by sex, age, method and histology.
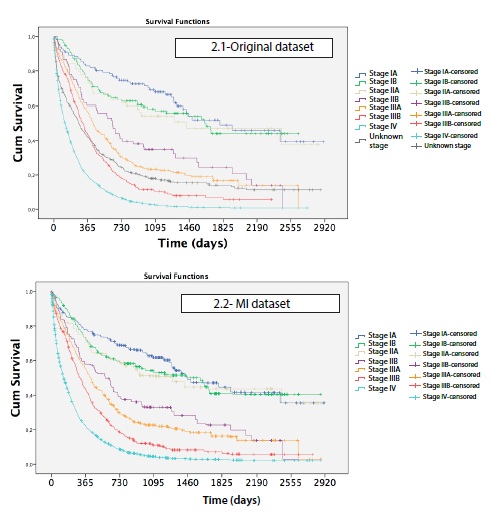
Age, sex, histology, stage and the time-dependent variables of age and histology were included in the extended Cox regression model before and after MI (Table 3). Both models (original vs. MI model) were similar and determined that women, younger cases, patients with adenocarcinoma and patients diagnosed in IA, IB and IIA stages have a better prognosis.
| Model 1Original Data Setn = 2,246 | Model 2(Imputed Data Set)n = 2,576 | |||||||
| Hazard Ratio | Std. Err. | p | 95% CI | Hazard Ratio | Std. Err. | p | 95% CI | |
| Main Covariates | ||||||||
| Age (linear) | 1.01 | 0.00 | 0.000 | 1.01; 1.02 | 1.01 | 0.00 | 0.000 | 1.01; 1.02 |
| Sex (Ref. Women) | ||||||||
| Men | 1.26 | 0.08 | 0.000 | 1.12; 1.42 | 1.27 | 0.08 | 0.000 | 1.13; 1.42 |
| Histology (Ref. Adenocarcinoma) | ||||||||
| Small cell carcinoma | 1.29 | 0.14 | 0.020 | 1.04; 1.59 | 1.27 | 0.13 | 0.019 | 1.04; 1.56 |
| Squamous carcinoma | 1.25 | 0.10 | 0.007 | 1.06; 1.47 | 1.26 | 0.10 | 0.004 | 1.08; 1.47 |
| Other and unspecified | 1.15 | 0.31 | 0.124 | 0.96; 1.38 | 1.11 | 0.10 | 0.216 | 0.94; 1.32 |
| Stage (Ref. Stage IA) | ||||||||
| Stage IB | 1.22 | 0.24 | 0.332 | 0.82; 1.80 | 1.21 | 0.28 | 0.412 | 0.77; 1.90 |
| Stage IIA | 1.31 | 0.31 | 0.243 | 0.83; 2.07 | 1.31 | 0.27 | 0.425 | 0.77; 1.87 |
| Stage IIB | 2.28 | 0.46 | 0.000 | 1.53; 3.40 | 2.26 | 0.48 | 0.000 | 1.49; 3.42 |
| Stage IIIA | 3.09 | 0.51 | 0.000 | 2.23; 4.27 | 3.05 | 0.57 | 0.000 | 2.11; 4.42 |
| Stage IIIB | 4.46 | 0.73 | 0.000 | 3.24; 6.15 | 4.51 | 0.79 | 0.000 | 3.20; 6.37 |
| Stage IV | 8.65 | 1.32 | 0.000 | 6.41; 11.67 | 8.74 | 1.50 | 0.000 | 6.21; 12.31 |
| Time Dependent Covariates | ||||||||
| Age | 0.996 | 0.00 | 0.002 | 0.993; 0.998 | 0.996 | 0.00 | 0.003 | 0.994; 0.999 |
| Histology (Ref. Adenocarcinoma) | ||||||||
| Small cell carcinoma | 0.95 | 0.05 | 0.338 | 0.86; 1.05 | 0.98 | 0.05 | 0.598 | 0.89; 1.07 |
| Squamous carcinoma | 1.04 | 0.05 | 0.438 | 0.95; 1.13 | 1.05 | 0.04 | 0.293 | 0.96; 1.14 |
| Other and unspecified | 0.86 | 0.04 | 0.000 | 0.79; 0.93 | 0.86 | 0.03 | 0.000 | 0.79; 0.92 |
DISCUSSION
Only 13% of the cases were diagnosed in the early stages, so clearly an effort should be made to make progress in secondary prevention. The US National Lung Screening Trial showed a 20% reduction in cancer related mortality and a 6.7% reduction in all-cause mortality in smokers or former smokers aged 50-75 years who had low radiation dose CT compared to chest X-ray. Since then, it has been argued that more trials are needed to confirm the findings, so seven large-scale European trials are currently in progress [20]. Until effectiveness of secondary prevention is proved, primary prevention for lung cancer is the best option through reinforcing tobacco control.
In 12.8% of cases the stage was missing, even though clinical records of all cases were reviewed deeply. The percentage of unknown stages for lung cancer in SEER statistics [21] is much lower, around 2%, but it is important to consider that Local-Regional-Disseminated classification is used and not TNM. Multiple imputation of unknown stages was a useful tool to make the most of the database, as other studies previously reported [9,19]. Although multiple imputation did not shift stage distribution, survival rates changed significantly in lung and colorectal cancers [19] after this statistical procedure.
We have confirmed that women have better prognosis in lung cancer independently of histology, as previously shown for non-small-cell lung cancers [22], which contradicts previous studies that attributed better survival in women to the predominance of adenocarcinoma type [23]. The reasons for cancer survival differences in favour of women, not only in lung cancer but in many other cancers as salivary glands, head and neck, oesophagus, stomach, colon and rectum, pancreas, pleura, bone, melanoma of skin, kidney, brain, thyroid, Hodgkin disease and non-Hodgkin’s lymphoma [24], have also been linked to hormonal status, different exposure to risk factors, specific driver mutations or better response to treatments, but today they remain unknown [24-25].
Age was associated with worse prognosis, as has been observed in other studies [14,24]. The novelty in our case was that we designed an extended Cox regression model incorporating age as a time-dependent variable, and we observed that the negative effect of age on survival decreases over time. This counters the hypothesis that age differences in survival are due to differences in treatment [14].
Finally, we observed differences by histologic group. Adenocarcinoma and squamous carcinoma had similar survival curves, better than the one for small cell carcinoma. Nevertheless, when we adjusted for sex, age and stage in the multivariate Cox analysis, the survival of adenocarcinoma was better than squamous carcinoma and small cell carcinoma survival. Other studies found no differences between non-small cell and small cell carcinomas, probably because they had a non-insignificant percentage of non-microscopically verified cases [8].
The limitations of this study were the availability of data from only one registry, as well as the lack of information about other prognostic factors such as comorbidities, active and passive smoking exposure, socioeconomic and performance status, type of therapy and its related toxicity or molecular status. Unfortunately, most of population-based cancer registries, at least in Europe, do not regularly collect all this information.
To sum up, lung cancer survival was similar for IA, IB and IIA stages, but remarkably worse in more advanced stages. Besides stage, female and adenocarcinoma cases had better prognosis; the reasons could be related, but to date are still unknown, so more research is needed in this field.
REFERENCES
- Ferlay J, Soerjomataram I, Ervik M, Dikshit R, Eser S, et al. (2013) GLOBOCAN v1.0, Cancer Incidence and Mortality Worldwide: IARC CancerBase No. 11. International Agency for Research on Cancer, Lyon, France.
- Galceran J, Ameijide A, Carulla M, Mateos A, Quirós JR, et al. (2017) Cancer Incidence in Spain 2015. Clin Trans Oncol 19: 799-825.
- National Center for Epidemiology, Epidemiology analysis and health situation area. Carlos III Institute of Health. National Center for Epidemiology, Hungary.
- Allemani C, Weir HK, Carreira H, Harewood R, Spika D, et al. (2015) Global surveillance of cancer survival 1995-2009: analysis of individual data for 25,676,887 patients from 279 population-based registries in 67 countries (CONCORD-2). The Lancet 385: 977-1010.
- De Angelis R, Sant M, Coleman MP, Francisci S, Baili P, et al. (2014) Cancer survival in Europe 1999-2007 by country and age: results of EUROCARE--5-a population-based study. Lancet Oncol 15: 23-34.
- Chirlaque MD, Salmerón D, Ardanaz E, Galceran J, Martínez R, et al. (2010) C. Cancer survival in Spain: estimate for nine major cancers. Ann Oncol 21: 21-29.
- Mc Devitt (2011) Lung cancer incidence, mortality treatment and survival in the Republic of Ireland: 1994-2008. National Cancer Registry Cork, Ireland.
- Mangone L, Minicozzi P, Vicentini M, Giacomin A, Caldarella A, et al. (2013) Key factors influencing lung cancer survival in northern Italy. Cancer Epidemiol 37: 226-232.
- Walters S, Maringe C, Coleman MP, Peake MD, Butler J, et al. (2013) Lung cancer survival and stage at diagnosis in Australia, Canada, Denmark, Norway, Sweden and the United Kingdom: a population-based study, 2004-2007. Thorax 68: 551-564.
- Ramos M, Franch P, Zaforteza M, Artero J, Duran M (2015) Completeness of T, N, M and stage grouping for all cancers in the Mallorca Cancer Registry. BMC Cancer 15: 847.
- Francisci S, Minicozzi P, Pierannunzio D, Ardanaz E, Eberle A, et al. (2015) Survival patterns in lung and pleural cancer in Europe 1999-2007: Results from the EUROCARE-5 study. Eur J Cancer 51: 2242-2253.
- Lin J, Beer DG (2012) Molecular predictors of prognosis in lung cancer. Ann Surg Oncol 19: 669-676.
- Dalton SO, Steding-Jessen M, Jakobsen E, Mellemgaard A, Østerlind K, et al. (2015) Socioeconomic position and survival after lung cancer: Influence of stage, treatment and comorbidity among Danish patients with lung cancer diagnosed in 2004-2010. Acta Oncol 54: 797-804.
- Pedersen AB, Mikkelsen EM, Cronin-Fenton D, Kristensen NR, Pham TM, et al. (2017) Missing data and multiple imputation in clinical epidemiological research. Clin Epidemiol 9: 157-166.
- Fritz A, Percy C, Jack A, Shanmugaratnam K, Sobin L, (2000) International Classification of Diseases for Oncology (ICD-O), (3rd edn). World Health Organisation, Geneva, Switzerland.
- Parkin DM, Shanmugaratnam K, Sobin L, Ferlay J, Whelan S (1998) Histological groups for comparative studies. IARC, Lyon, France.
- Sobin LH, Gospodarowicz MK, Wittekind C (2011) TNM classification of malignant tumours. Wiley-Blackwell, Oxford, England.
- Rubin DB (1987) Multiple imputation for nonresponse in surveys. John Wiley & Sons, New Jersey, USA.
- Ramos M, Montaño J, Esteva M, Barceló A, Franch P (2016) Colorectal cancer survival by stage of cases diagnosed in Mallorca, Spain, between 2006 and 2011 and factors associated with survival. Cancer Epidemiol 41: 63-70.
- Jones GS, Baldwin DR (2015) Lung cancer screening and management. Minerva Med 106: 339-354.
- National Institutes of Health, SEER Cancer Statistics Review 1975-2014. National Cancer Institute, National Institutes of Health, Maryland, USA.
- Nakamura H, Ando K, Shinmyo T, Morita K, Mochizuki A, et al. (2011) Female gender is an independent prognostic factor in non-small-cell lung cancer: a meta-analysis. Ann Thorac Cardiovasc Surg 17: 469-480.
- Wheatley-Price P, Blackhall F, Lee SM, Ma C, Ashcroft L, et al. (2010) The influence of sex and histology on outcomes in non-small-cell lung cancer: a pooled analysis of five randomized trials. Ann Oncol 21: 2023-2028.
- Micheli A, Ciampichini R, Oberaigner W, Ciccolallo L, de Vries E, et al. (2009) The advantage of women in cancer survival: an analysis of EUROCARE-4 data. Eur J Cancer 45: 1017-1027.
- Remon J, Molina-Montes E, Majem M, Lianes P, Isla D, et al. (2014) Lung cancer in women: an overview with special focus on Spanish women. Clin Transl Oncol 16: 517-528.
Citation: Ramos M, Montaño J, Rubio A, Franch P (2017) Lung Cancer Survival by Stage of Cases Diagnosed In Mallorca, Spain, Between 2006 and 2011 and Factors Associated With Survival. J Pulm Med Respir Res 3: 012.
Copyright: © 2019 Maria Ramos, et al. This is an open-access article distributed under the terms of the Creative Commons Attribution License, which permits unrestricted use, distribution, and reproduction in any medium, provided the original author and source are credited.