Seasonal Variations in the Hydrogeochemistry and the Domestic-Agro-Industrial Water Quality of the Granite-Gneiss Fractured Rock Aquiferous formations in Wum, North West Region, Cameroon
*Corresponding Author(s):
Akoachere RADepartment Of Geology, University Of Buea, Buea, Cameroon
Tel:+237 690153887,
Email:r.akoachere@ubuea.cm
Abstract
Keywords
INTRODUCTION
Climate
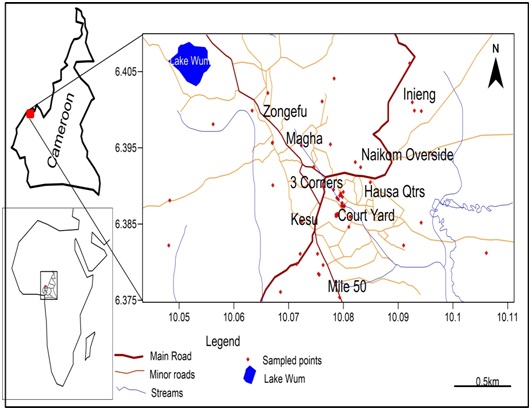
Wum Municipality falls within the tropical humid climatic zone with some modifications due to the high and lowland areas found in this region. There is a distinct rainy season from mid-March to mid-November and dry seasons from mid-November to mid-March. The annual rainfall ranges between 2512.5mm and 3829.6mm.The total annual rainy days ranges from 173 to 196. August and February are the coldest and hottest months respectively.
Vegetation
Lying in the savannah part of Cameroon, Wum has two common vegetation types, forests and grasslands. The forest in this region is the tropical transitional forests. Vegetation is of the Guinea Savanna type constituting mostly eucalyptus trees and raffia palms found mostly in valleys where the water table is considerably low [2] .
Relief and drainage
Wum is part of the Bamenda highlands, a chain of Precambrian hills with rocky cliffs. Most of the hills are conical and flat topped. The relief is monotonous with continuous chains of hills and valleys. Major hilly areas include Kesu to Mile 40 with spot height of 1130m. Slopes in Wum are steep 35-40°.
The drainage in Wum subdivision is dendritic with swift running Nweih, Nzala, Muoh and Menchum perennial rivers whose discharges increase significantly in the rainy season; Four lakes abound; Ilum, Oshien and Atwe. The river Menchum falls over one of the highest cliffs in West Africa. The larger rivers and lakes are far off from Wum town. Cameroon is gifted with large volumes of water resources with the second largest volume of available freshwater in Africa (After the Democratic Republic of Congo) estimated at 322 billion m3. Groundwater constitutes 21.5 percent (57 billion m3) of this resource and plays a vital role in the socio economic life of the country. Most rural communities in Cameroon rely on ground water to meet their water needs. Ironically, most of this enormous quantity of groundwater is of dubious quality and inaccessible due to lack of appropriate skilled professionals, equipment or financial resources allocated for this purpose. This is not different in Wum where there is an acute shortage of water with the present increase in population especially during the dry season due to the fact that there are only small surface streams in the town that together with wells dry up.
Geology and hydrogeology
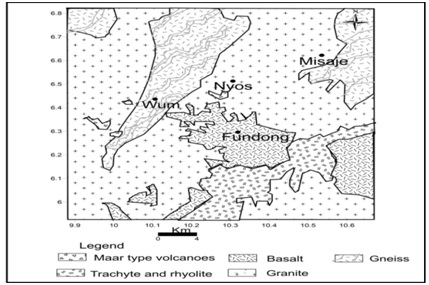
Wum is located on the oku volcanic field on the Cameroon Volcanic Line CVL. The CVL is a N30E oriented tectonic structure made up of volcanic islands, continental volcanoes, plutonic and volcanic complexes ranging in age from 82 Ma to present. The CVL bears the active Mt Cameroon with latest eruptions in 1999 and 2000, with over 100 cinder cones and 40 maars presumed to be not older than 1 Ma Gaudru and Tchouankoue [3]. The Nyos maar is located in the southern continental part of the CVL and belongs to the monogenetic Oku volcanic field that culminates at Mt Oku (3011m). Volcanic activity in the Oku volcanic field ranges from effusive to explosive, and a wide range of compositions have been erupted including basanite, basalt, hawaiite, mugearite, trachyte, and rhyolite. Basement rocks are gneisses and granitoids, which formed during the Pan-African orogeny (~600 Ma) Pinte et al., [4]. The basement of Wum and its vicinity is mostly formed of granitic rocks of dominant micropegmatitic texture. Basaltic rocks appear as small flows directly overlapping the granitic basement. Pyroclastic surge deposits are found near the Lake Nyos crater and cap the basalt flows to the west of the volcano. The pyroclastic rocks contain broken pieces of basement granites and peridotite xenoliths Schmidt et al., 2017 [5]. The aquiferous formations of Wum are mainly the regolith and the fractured crystalline rocks; granites gneisses and basaltspresented in figure 2.
The suitability of water for irrigation depends on the effects of the mineral constituents of water on both the plant and the soil [6]. Excessive amounts of dissolved ions in irrigation water affect plants and agricultural soil physically and chemically, thus reducing the productivity, thus parameters such as Electrical Conductivity EC, sodium percentage (Na%), Sodium Adsorption Ratio (SAR), Magnesium Adsorption Ratio (MAR), Residual sodium carbonate and Permeability Index (PI) were used to assess the suitability of ground water for irrigation purposes [7].
Assessment of water for agro-industrial suitability is important inorder to determine whether the water will have an adverse effect on the soil properties if used as irrigation water [8].This is vital for the development of an agricultural zone like Wum where farming is the major occupation of the citizens and there are currently studies going on to create large scale cash crop plantations.
MATERIALS AND METHODS
The field materials and equipment used in this study are listed in Table 1.
|
Equipment/Softwares |
Specifications |
Functions |
|
Bike |
Commercial bikes (Bensikin) |
To transport fieldworkers to wells |
|
GPS |
Garmin GPSMAP 60CSx |
To measure longitude, latitude and elevation of wells |
|
EC Meter |
Hanna HI 98304/HI98303 |
To measure electrical conductivity of water. |
|
pH Meter |
Hanna HI 98127/HI98107 |
To measure pH of water. |
|
Water level indicator |
Solinst model 102M |
To indicate static water levels of water in wells |
|
Measuring Tape |
Weighted measuring tape |
Measurement of well diameter and depth. |
|
Digital Thermometer |
Extech 39240 (-50 to 200oC) |
To measure temperature of water |
|
Total Dissolved Solid meter |
Hanna HI 96301 with ATC |
To measure Total dissolved solids in water |
|
Water sampler |
Gallenkampf 1000ml |
To collect well water sample from well |
|
Sample bottles |
Polystyrene 500ml |
To hold sample for onward transmission to laboratory |
|
Global Mapper |
Version 15 |
GIS Geolocation of wells |
|
Surfer Golden Software |
Version 12 |
GIS plotting contours for spatial distribution |
|
AqQA/Aquachem |
Version 1.5 |
For the analysis/interpretation of water chemistry |
Methods
Prior to field tests, measurements and sampling, a reconnaissance field survey was carried out to identify and select representative wells and springs ISO 5667-1 [9].
Field measurements, tests and sampling were carried out in four hydrogeological seasons: dry (March), drywet (June), wet (September) and wetdry seasons (December). The study area was divided into 5 sections representing the main quarters. 31 representative wells and 7 springs were tested. 10 samples two samples per section were analyzed per season, except in the dry season where one sample was collected per section as many wells got dry. Seasonal measurements were carried out in situ for: coordinates of wells, Surface elevation, Well water level, dug wells depths well diameter, Electrical Conductivity (EC), pH, Total Dissolved Solids (TDS) and temperature. groundwater samples were collected in a High Density Polyethylene (HDPE) 500 ml bottles, sealed and sent to the laboratory using standardprotocols ISO 5667-3 [10], ISO 5667-11 [11] and methods APHA [12] to analyze for:
• Major cations in mg/L: Ca2+, Mg2+, Na+, K+ and NH4+.
• Major anions in mg/L: HCO3-, Cl- , SO42-, HPO42- and NO3-
Ionic ratio for indicative elements is a useful hydrogeochemical tool to identify source rock of ions and formation contribution to solute hydrogeochemistry Hounslow [13]. These were used in this study.
Gibbs diagram is a plot of Na+/ (Na++HCO3- Ca2+) and Cl-/ (Cl-+HCO 3-) as a function of TDS are widely employed to determine the sources of dissolved geochemical constituents Gibbs [14]. These plots reveal the relationships between water composition and the three main hydrogeochemical processes involved in ions acquisition; atmospheric precipitation, rock weathering or evaporation crystallisation. Pipers diagram is a graphical representation of the chemistry of water sample on three fields; the cation ternary field with Ca, Mg and Na+K apices, the anion ternary field with HCO3, SO4 and Cl- apices. These two fields are projected onto a third diamond field Piper [15]. The diamond field is a matrix transformation of the graph of the anions [SO42- + Cl-]/? anions and cations [Na+K]/? cations. This plot is a useful hydrogeochemical tool to compare water samples, determine water type and hydrogeochemical facies Langguth [16].This has been used here for these purposes. Durov diagram is a composite plot consisting of two ternary diagrams where the mill equivalent percentages of cations are plotted perpendicularly against those of anions; the sides of the triangles form a central rectangular binary plot of total cation vs. total anion concentrations Durov [17]. The central rectangle is divided into nine classes which give the hydrogeochemical processes determining the character of the water types in the aquiferous formation Langguth [16], Lloyd and Heathcote [18].
WQI was calculated by adopting Weighted Arithmetical Index method considering thirteen water quality parameters (pH, EC, TDS, total alkalinity, total hardness, Na+, Mg2+, Na+, K+, Cl-, SO42-, NO3-, NH4+) and the WHO guidelines [19] in order to assess the degree of groundwater contamination and suitability table 2 Sisodia and Moundiotiya [20].
|
|
Formula |
Reference |
|
Percentage Sodium |
|
Wilcox (1955) [21] |
|
Kelly’s Ratio |
|
Kelly (1940) [22] |
|
Magnesium Adsorption Ratio |
|
Palliwal (1972) [23] |
|
Total Hardness |
TH (CaCO3) mg/L = 2.5 Ca2+ + 4.1Mg2+ |
Todd (1980) [24] |
|
Residual Sodium Carbonate |
|
Eaton (1950) [25] |
|
Sodium Adsorption Ratio |
|
Richard (1954) [26] |
|
Permeability Index |
|
Doneen (1962) [27] |
|
Water Quality Index |
|
Sisodia and Moundiotiya (2006) [20] |
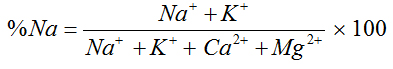
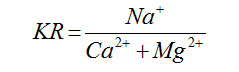
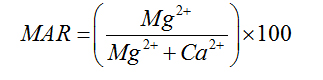
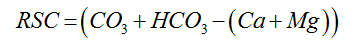
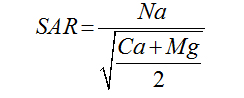
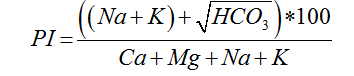
For the determination of agro-industrial suitability of groundwater in Wum, the following parameters and indices; sodium adsorption ratio SAR, permeability index PI, Magnesium adsorption ratio, percent sodium, Kelly’s ratio, Residual sodium carbonate and Wilcox diagram presented in Table2, together with the following softwares platforms; Surfer 12, Global mapper 11 and AqQA 1.5 AGIS 10.3 were used for data presentation, interpretation and analysis.
RESULTS AND DISCUSSION
The physicochemical parameters of groundwater in Wum: Temperature, pH, EC and TDS for 10 wells and springs were evaluated and presented in table 3. All physicochemical parameters vary with seasons indicating seasonal influence on the phreatic aquifer.
|
Test |
Dry |
Dry Wet |
Wet |
Wet Dry |
||||||||||||
|
Min |
Max |
Mean |
Std |
Min |
Max |
Mean |
Std |
Min |
Max |
Mean |
Std |
Min |
Max |
Mean |
Std |
|
|
T(oC) |
21.5 |
25.3 |
23.0 |
23.0 |
0.1 |
23.1 |
26.7 |
26.1 |
20.8 |
26.6 |
23.0 |
22.9 |
21.8 |
24.1 |
22.7 |
22.7 |
|
PH |
- |
- |
- |
- |
2.6 |
16.9 |
6.51 |
6.40 |
3.3 |
7.1 |
5.44 |
5.37 |
5.2 |
7.5 |
6.25 |
6.21 |
|
EC(mS/cm) |
0.01 |
0.51 |
0.11 |
0.12 |
0.01 |
6.30 |
0.26 |
1.01 |
0.17 |
3.90 |
1.13 |
0.95 |
0.01 |
3.29 |
1.05 |
0.83 |
|
TDS(mg/L) |
0.01 |
0.34 |
0.07 |
0.08 |
0.01 |
4.22 |
0.17 |
0.68 |
0.11 |
2.61 |
0.76 |
0.64 |
0.01 |
2.20 |
0.70 |
0.55 |
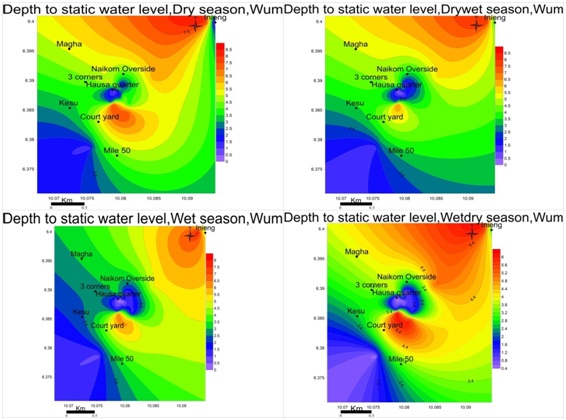
Water level fluctuations: Groundwater levels vary in conformity with changes in precipitations in all four seasons typical of phreatic aquiferous formationsas shown in figure 3.
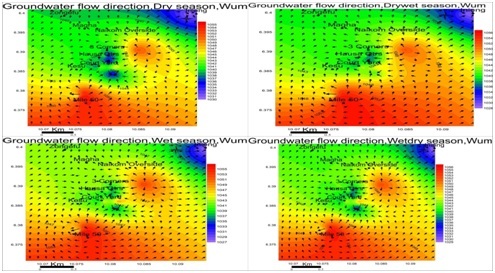
Groundwater flow direction: Water level contours are similar to surface elevation contours. This indicates groundwater table mimics topography typical of phreatic aquifers. Flow is towards the northeastern parts of the study area for all seasons figure 4.
The levels of groundwater in a basement environment like Wum is controlled by the presence and extent of the weathered overburden/regolith as well as fissures, joints and fractures system in the underlying bedrock (Tijani et al.,2010) [28].
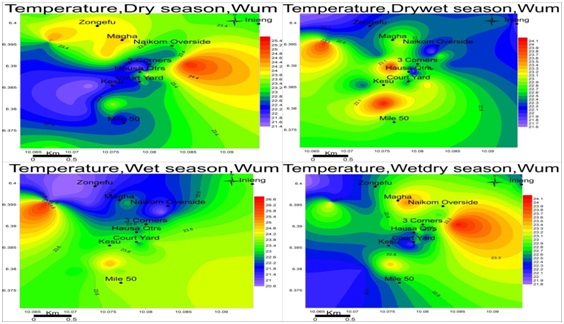
Temperature: The temperature of the groundwater in Wum is relatively low, ranged between 21.5-25.3 dry, 21.7-23.1 drywet, 20.8-26.6 wet and 21.8-24.1 wetdry seasons respectively figure 5. The temperature variation was similar in the different areas, suggesting a single aquifer since groundwater in the same aquifers have similar parameter values and temperature is one of them.
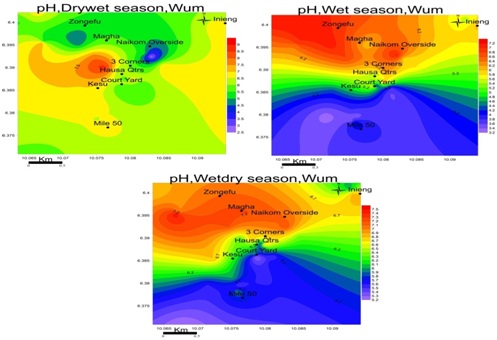
pH: The pH of groundwater samples in the study area range from; 2.6-6.9 drywet, 3.3-7.1 wet and 5.2-7.5 wetdry season figure 6. This indicates that groundwater is acidic to per alkaline in all seasons.
Electrical conductivity: The observed conductance in the study area was low in all seasons, ranging from 0.01-0.51mS/cm in the dry season, 0.01-6.30mS/cm in the drywet season, 0.17-3.90mS/cm in the wet season and 0.01-3.29mS/cm wet-dry season as shown in figure 7. These low values of EC and TDS are a reflection of low salt content in groundwater. EC is highest in Magha and 3-corners for the dry season; Mile-50 in the drywet: Hausa quarter and naikom for wet and Courtyard for the wetdry season.
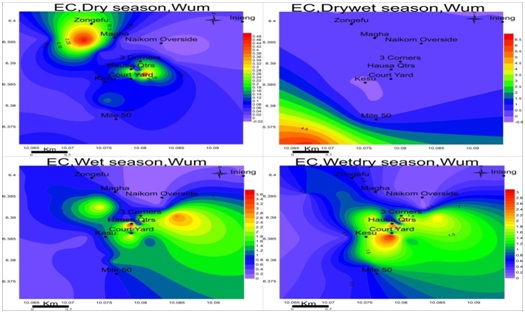 Figure 7: Spatial variation of electrical conductivities (mS/cm) in wum for four seasons; EC is at maximum in the drywet season and minimum in the dry season.
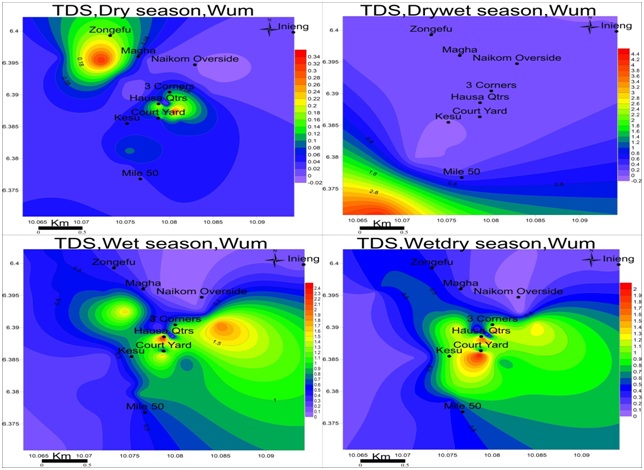
Total dissolved solids: The values of TDS range from 0.01-0.34mg/L in the dry season, 0.01-4.22mg/L drywet season, 0.11-2.61mg/L wet season and 0.01-2.20mg/L wetdry season with the highest value observed in the wet season as in figure 8. TDS is highest at Magha and 3-corners for dry season: Mile-50 in the drywet season: Hausa quarter and Naikom in the wet season and Courtyard for Wetdry season.TDS is highest in drywet season due to the absence of rain in the formations, at this point the ionic concentration is higher but moving towards the heart of rainy season and groundwater becomes more dilute and keeps decreasing each season until the next drywet season.
The ionic content varied with seasons as presented in tables 4, 5, 6 and 7. During the dry season the ionic trend was Ca2+>Mg2+>NH4+>K+>Na+, for cations and HCO3->Cl->SO42->NO3->HPO42- for anions. This same pattern was observed in most of the areas with exceptions in Hilltop, where K+ was greater than NH4+. A different trend was observed in the anions where HPO42- was greater than NO3- in Zongefu and Manyi. However, Cl- was absent in most samples but whenever it was present, it usually had a higher value than SO42- giving it a higher total concentration.
|
Dry Season (mg/L) |
||||||||||
|
Location |
Na+ |
K+ |
Mg2+ |
Ca2+ |
NH4+ |
HCO3 |
NO3- |
SO42- |
Cl- |
HPO4 |
|
Zongefusp |
0.13 |
0.54 |
5.00 |
5.00 |
4.95 |
6.1 |
0 |
1.29 |
0 |
0.12 |
|
Twins wl |
0.45 |
5.02 |
19.9 |
19.9 |
3.91 |
23.18 |
1.23 |
1.94 |
16 |
0.03 |
|
Hilltop sp |
0.03 |
0.16 |
5.00 |
5.00 |
5.73 |
8.54 |
0 |
2.07 |
0 |
0 |
|
Manyiwl |
0.1 |
0.54 |
9.85 |
9.85 |
5.01 |
8.54 |
0 |
1.75 |
0 |
0.11 |
|
Jopaccst |
0.19 |
2.15 |
9.8 |
9.8 |
6.15 |
51.2 |
1.86 |
4.08 |
2 |
0 |
|
Min |
0.03 |
0.16 |
5 |
5 |
3.91 |
6.1 |
0 |
1.29 |
0 |
0 |
|
Max |
0.45 |
5.02 |
19.9 |
19.9 |
6.15 |
51.2 |
1.86 |
4.08 |
16 |
0.12 |
|
Mean |
0.18 |
1.68 |
9.91 |
9.91 |
5.15 |
19.51 |
0.62 |
2.23 |
3.60 |
0.05 |
|
Std. |
0.16 |
2.02 |
6.08 |
6.08 |
0.85 |
18.00 |
0.88 |
1.08 |
6.99 |
0.06 |
|
Drywet Season (mg/L) |
||||||||||
|
Location |
Na+ |
K+ |
Ca2+ |
Mg2+ |
NH4+ |
HCO3- |
NO3- |
SO42- |
Cl- |
HPO4- |
|
Zongefu |
0.18 |
3.99 |
9.11 |
1.23 |
0.19 |
45.01 |
2.34 |
0.84 |
0.42 |
0.00 |
|
Kesu |
0.14 |
3.24 |
7.38 |
1.45 |
0.15 |
40.26 |
1.05 |
0.96 |
0.32 |
0.00 |
|
Checksense |
0.40 |
4.34 |
13.21 |
9.21 |
0.89 |
20.03 |
12.90 |
2.12 |
0.84 |
0.00 |
|
Twins |
0.60 |
5.97 |
22.16 |
3.69 |
0.00 |
45.14 |
4.28 |
1.69 |
3.68 |
0.00 |
|
Hilltop |
0.16 |
3.00 |
6.22 |
1.35 |
0.13 |
39.91 |
1.01 |
0.91 |
0.31 |
0.00 |
|
Ndangasen |
0.70 |
6.90 |
25.01 |
5.33 |
0.50 |
48.99 |
7.99 |
3.19 |
4.95 |
0.00 |
|
Canteen |
0.00 |
0.00 |
2.46 |
0.92 |
1.61 |
17.08 |
3.03 |
8.71 |
0.84 |
0.00 |
|
Manyi |
0.41 |
5.53 |
14.22 |
9.65 |
0.75 |
21.45 |
11.67 |
3.65 |
0.84 |
0.00 |
|
Jopacc |
0.05 |
1.44 |
2.46 |
2.11 |
0.10 |
56.12 |
0.07 |
1.82 |
0.63 |
0.00 |
|
Jean |
0.30 |
4.41 |
12.32 |
8.63 |
0.69 |
18.30 |
10.33 |
1.19 |
0.74 |
0.00 |
|
Min |
0.00 |
0.00 |
2.46 |
0.92 |
0.00 |
17.08 |
0.07 |
0.84 |
0.31 |
0.00 |
|
Max |
0.70 |
6.90 |
25.01 |
9.65 |
1.61 |
56.12 |
12.90 |
8.71 |
4.95 |
0.00 |
|
Mean |
0.29 |
3.88 |
11.46 |
4.36 |
0.50 |
35.23 |
5.47 |
2.51 |
1.36 |
0.00 |
|
Std. |
0.23 |
2.08 |
7.61 |
3.58 |
0.50 |
14.54 |
4.82 |
2.38 |
1.60 |
0.00 |
|
Wet Season (mg/L) |
||||||||||
|
Location |
Na+ |
K+ |
Ca2+ |
Mg2+ |
NH4+ |
HCO3- |
NO3_ |
SO42- |
Cl- |
HPO4- |
|
Zongefu |
0.15 |
4.11 |
4.11 |
8.91 |
0.12 |
48.27 |
2.26 |
0.74 |
0.51 |
0.00 |
|
Kesu |
0.21 |
5.01 |
5.01 |
12.11 |
0.25 |
54.05 |
3.42 |
0.62 |
0.63 |
0.00 |
|
Checksense |
0.44 |
5.21 |
5.21 |
12.11 |
0.91 |
40.05 |
14.10 |
1.95 |
0.89 |
0.10 |
|
Twins |
0.90 |
5.90 |
5.90 |
23.31 |
0.04 |
65.25 |
9.30 |
1.05 |
4.89 |
0.20 |
|
Hilltop |
0.13 |
4.11 |
4.11 |
5.35 |
0.21 |
49.17 |
3.05 |
0.75 |
0.52 |
0.00 |
|
Ndangasen |
0.90 |
7.01 |
7.01 |
24.05 |
0.80 |
51.25 |
8.95 |
2.81 |
4.99 |
0.00 |
|
Canteen |
0.10 |
0.21 |
0.21 |
3.11 |
1.95 |
27.09 |
6.08 |
7.11 |
0.94 |
0.00 |
|
Manyi |
0.45 |
6.22 |
6.22 |
15.51 |
0.81 |
20.95 |
11.95 |
2.44 |
0.96 |
0.00 |
|
Jopacc |
0.08 |
2.41 |
2.41 |
3.51 |
0.25 |
58.11 |
1.18 |
1.02 |
0.85 |
0.00 |
|
Jean |
0.50 |
5.01 |
5.01 |
15.21 |
0.85 |
20.95 |
11.45 |
0.99 |
0.93 |
0.10 |
|
Min |
0.08 |
0.21 |
0.21 |
3.11 |
0.04 |
20.95 |
1.18 |
0.62 |
0.51 |
0.00 |
|
Max |
0.90 |
7.01 |
7.01 |
24.05 |
1.95 |
65.25 |
14.10 |
7.11 |
4.99 |
0.20 |
|
Mean |
0.39 |
4.52 |
4.52 |
12.32 |
0.62 |
43.51 |
7.17 |
1.95 |
1.61 |
0.04 |
|
Std. |
0.31 |
1.98 |
1.98 |
7.45 |
0.58 |
15.67 |
4.58 |
1.97 |
1.76 |
0.07 |
|
Wetdry Season (mg/L) |
||||||||||
|
Location |
Na+ |
K+ |
Ca2+ |
Mg2+ |
NH4+ |
HCO3- |
NO3_ |
SO42- |
Cl- |
HPO-4 |
|
Zongefu |
0.18 |
6.10 |
10.03 |
1.03 |
0.12 |
50.71 |
2.84 |
2.84 |
0.73 |
0.20 |
|
Kesu |
0.56 |
5.51 |
15.91 |
15.84 |
0.99 |
26.13 |
13.03 |
13.03 |
1.39 |
0.10 |
|
Checksense |
0.46 |
5.65 |
13.51 |
12.51 |
0.95 |
55.25 |
15.95 |
15.95 |
0.99 |
0.10 |
|
Twins |
0.95 |
5.89 |
25.93 |
17.03 |
0.82 |
73.99 |
11.47 |
11.47 |
6.22 |
0.30 |
|
Hilltop |
0.11 |
4.52 |
5.74 |
8.03 |
0.51 |
69.07 |
5.94 |
5.94 |
0.59 |
0.00 |
|
Ndangasen |
0.85 |
7.44 |
23.94 |
23.71 |
0.85 |
53.97 |
9.54 |
9.54 |
5.85 |
0.10 |
|
Canteen |
0.15 |
0.19 |
3.85 |
5.84 |
1.99 |
35.03 |
8.94 |
8.94 |
10.51 |
0.20 |
|
Manyi |
0.55 |
6.35 |
15.11 |
15.95 |
0.94 |
25.11 |
11.99 |
11.99 |
0.97 |
0.00 |
|
Jopacc |
0.15 |
2.59 |
4.05 |
4.05 |
0.31 |
61.01 |
1.21 |
1.21 |
1.43 |
0.00 |
|
Jean |
0.35 |
8.08 |
13.84 |
1.51 |
0.34 |
74.32 |
5.96 |
5.96 |
0.94 |
0.00 |
|
Min |
0.11 |
0.19 |
3.85 |
1.03 |
0.12 |
25.11 |
1.21 |
1.21 |
0.59 |
0.00 |
|
Max |
0.95 |
8.08 |
25.93 |
23.71 |
1.99 |
74.32 |
15.95 |
15.95 |
10.51 |
0.30 |
|
Mean |
0.43 |
5.23 |
13.19 |
10.55 |
0.78 |
52.46 |
8.69 |
8.69 |
2.96 |
0.10 |
|
Std. |
0.30 |
2.32 |
7.64 |
7.60 |
0.53 |
18.40 |
4.67 |
4.67 |
3.39 |
0.11 |
In the drywet season the trend was Ca2+>Mg2+>NH4+>K+>Na+ for cations and HCO3->NO3->SO42->Cl->HPO42- for anions though at Canteen, Ndangasen, Jopacc and Twins Cl->SO42-.
Wet season: The trend was Mg2+>Ca2+>K+>NH4+>Na+ and HCO3->NO3->SO42->Cl->HPO42-. In Zongefu, Twins and Ndangasen for cations as Na+>NH4+and for the anions in Twins and Ndangasen Cl-> SO42-.
Wetdry season: The trend was Ca2+>Mg2+>K+>NH4+>Na+ for cations though Na+>NH4+ in Kesu and Zongefu. For Anions, it was in the order; HCO3-> SO42->NO3->Cl->HPO42- even though Cl->NO3- in Canteen.
Ionic ratios of groundwater
Ionic ratios of groundwater in Wum have been determined as presented in tables 8, 9, 10 and 11 and used to infer the sources and formation contribution to groundwater ionic contentin table 12.
|
No |
SO4 |
Na |
Mg |
Na |
Ca |
Ca |
Ca |
(Ca+Mg) |
HCO3 |
NO3 |
SO4 |
Cl |
Na+K+Cl |
Na |
Mg |
Ca |
Ca+Mg |
Mg |
|
1 |
0.00 |
0.00 |
0.00 |
0.02 |
0.82 |
3.88 |
1.00 |
14.93 |
0.81 |
0.00 |
0.17 |
0.00 |
0.12 |
1.00 |
0.50 |
0.79 |
7.75 |
1.00 |
|
2 |
0.12 |
0.03 |
1.24 |
0.02 |
0.86 |
10.26 |
1.00 |
7.28 |
0.55 |
0.03 |
0.05 |
0.38 |
2.29 |
0.03 |
0.50 |
0.91 |
20.52 |
1.00 |
|
3 |
0.00 |
0.00 |
0.00 |
0.00 |
0.59 |
2.42 |
1.00 |
52.63 |
0.80 |
0.00 |
0.20 |
0.00 |
0.04 |
1.00 |
0.50 |
0.71 |
4.83 |
1.00 |
|
4 |
0.00 |
0.00 |
0.00 |
0.01 |
1.15 |
5.63 |
1.00 |
30.78 |
0.82 |
0.00 |
0.17 |
0.00 |
0.06 |
1.00 |
0.50 |
0.85 |
11.26 |
1.00 |
|
5 |
2.04 |
0.10 |
4.90 |
0.00 |
0.19 |
2.40 |
1.00 |
8.38 |
0.87 |
0.03 |
0.07 |
0.03 |
0.43 |
0.09 |
0.50 |
0.71 |
4.80 |
1.00 |
|
Min |
0.00 |
0.00 |
0.00 |
0.00 |
0.19 |
2.40 |
1.00 |
7.28 |
0.55 |
0.00 |
0.05 |
0.00 |
0.04 |
0.03 |
0.50 |
0.71 |
4.80 |
1.00 |
|
Max |
2.04 |
0.10 |
4.90 |
0.02 |
1.15 |
10.26 |
1.00 |
52.63 |
0.87 |
0.03 |
0.20 |
0.38 |
2.29 |
1.00 |
0.50 |
0.91 |
20.52 |
1.00 |
|
Mean |
0.43 |
0.02 |
1.23 |
0.01 |
0.72 |
4.92 |
1.00 |
22.80 |
0.77 |
0.01 |
0.13 |
0.08 |
0.59 |
0.62 |
0.50 |
0.79 |
9.83 |
1.00 |
|
Std. |
0.90 |
0.04 |
2.12 |
0.01 |
0.36 |
3.27 |
0.00 |
19.14 |
0.13 |
0.02 |
0.07 |
0.17 |
0.97 |
0.52 |
0.00 |
0.09 |
6.53 |
0.00 |
|
No |
SO4 |
Na |
Mg |
Na |
Ca |
Ca |
Ca |
(Ca+Mg) |
HCO3 |
NO3 |
SO4 |
Cl |
Na+K+Cl |
Na |
Mg |
Ca |
Ca+Mg |
Mg |
|
1 |
2.00 |
0.43 |
2.93 |
0.00 |
0.20 |
10.85 |
7.41 |
2.48 |
0.93 |
0.05 |
0.02 |
0.01 |
0.36 |
0.30 |
0.12 |
0.92 |
12.31 |
0.14 |
|
2 |
3.00 |
0.44 |
4.53 |
0.00 |
0.18 |
7.69 |
5.09 |
2.61 |
0.95 |
0.02 |
0.02 |
0.01 |
0.35 |
0.30 |
0.16 |
0.88 |
9.20 |
0.20 |
|
3 |
2.52 |
0.48 |
10.96 |
0.02 |
0.66 |
6.23 |
1.43 |
4.73 |
0.56 |
0.36 |
0.06 |
0.02 |
0.33 |
0.32 |
0.41 |
0.86 |
10.58 |
0.70 |
|
4 |
0.46 |
0.16 |
1.00 |
0.01 |
0.49 |
13.11 |
6.01 |
3.93 |
0.82 |
0.08 |
0.03 |
0.07 |
0.41 |
0.14 |
0.14 |
0.93 |
15.30 |
0.17 |
|
5 |
2.94 |
0.52 |
4.35 |
0.00 |
0.16 |
6.84 |
4.61 |
2.40 |
0.95 |
0.02 |
0.02 |
0.01 |
0.38 |
0.34 |
0.18 |
0.87 |
8.32 |
0.22 |
|
6 |
0.64 |
0.14 |
1.08 |
0.01 |
0.51 |
7.84 |
4.69 |
3.99 |
0.75 |
0.12 |
0.05 |
0.08 |
0.45 |
0.12 |
0.18 |
0.89 |
9.51 |
0.21 |