Seed Protein Diversity Assessment and Genetic Diversity among Different Soybean [Glycine max (L.) Merrill] Accession
*Corresponding Author(s):
Thapa PDepartment Of Genetics And Plant Breeding, Agriculture And Forestry University, Rampur, Chitwan, Nepal
Tel:977- 9842996262,
Email:pradip.thapa876@gmail.com
Abstract
Keywords
Correlation;Nodule;Morphology;Protein; Soybean
INTRODUCTION
Soybean is considered a miracle crop due to its multi-advantageous qualities i.e., food, feed, oil, fodder, soil sustainability and medicinal values. It contains about 37-42% of good quality protein, 6% ash, 29% carbohydrate and 17-24% oil comprising 85% unsaturated fatty acid with two essential fatty acids (lenoleic and linolenic acid) which are not synthesized by the human body so it is highly desirable in human diet[5].
Nitrogen is the most limiting element for crop growth and usually supplied by application of fertilizer, which brings on substantial costs to farmers and with potentially adverse effects on the environment. Being legume it also fixes atmospheric nitrogen into soil making it available to plants. As the best source of protein it truly claims the title “the meat that grows on plant”[6].Reported that soybean can capture an amount of 300 kg of nitrogen per hectare from the atmosphere. The leguminous plants establish a symbiotic relationship with rhizobia (symbiotic nitrogen fixation) to directly capture N2 to support plant growth. Nitrogen conversion takes place in a unique organ (root nodule). The development of root nodules commences with a molecular dialogue between the host plant and a compatible strain of rhizobium involving a succession of complex process that lead to profound changes in both symbiosis[7].
Latest statistics indicated that the area of soybean in Nepal was 23757 ha with an average productivity of 1.18 ton/ha (MOAD, 2015). In Nepal, soybean is being used from household consumption to commercial uses. Now soybean is considered as important crop because it is used as an important ingredient in feed industries and the soybean demands is growing rapidly. Everyday Nepal imports row or processed soybean in the estimated worth value 1-2 corer NRs from abroad (Brazil, Argentina, Ethiopia, India etc.,). With the quest of its importance, improved soybean varieties along with modern production packages are required to boost soybean production in Nepal.
The objectives of the research was
• To find out the high protein content soybean accession
• To find out the high yielding soybean accession
MATERIALS AND METHODS
|
S.N. |
Accession name |
Accession type |
Origin |
|
1 |
Cobb |
Released variety |
USA |
|
2 |
Hardee |
Released variety |
USA |
|
3 |
AGS-376 |
Pipeline variety |
|
|
4 |
Puja |
Released variety |
India |
|
5 |
LS-77-16-16 |
Pipeline variety |
|
|
6 |
Seti |
Release variety |
Taiwan,china |
|
7 |
Ransom |
Released variety |
USA |
|
8 |
Tarkari-Bhatmas-1 |
Released variety |
China |
|
9 |
PK-7394 |
Pipeline variety |
|
|
10 |
PK-327 |
Pipeline variety |
|
|
11 |
PI-94159 |
Pipeline variety |
|
|
12 |
F-778817 |
Pipeline variety |
|
|
13 |
IARS-87-1 |
Pipeline variety |
|
|
14 |
Iang-beakong |
Pipeline variety |
|
|
15 |
TGX1485-1D |
Pipeline variety |
|
METHOD OF PROTEIN DETERMINATION
A known weight of the sample was transferred to 250 ml Kjeldahl flask for determination of nitrogen by Micro-kjeldahl method. Into the flask, catalyst mixture (potassium sulphate + mercuric oxide) and concentrated H2SO4 were added. The mixture was boiled and digestion was continued until the color of the digest was colorless. The volume of the digest was made up to a known volume. Similarly a blank without the sample was run. The reduced nitrogen extracted by steam distillation from a definite volume of the digest was collected in boric acid solution. The nitrogen present in the boric acid solution was estimated by titrating with 0.02 N HCl using mixed indicator (methyl red and methylene blue). The blank distillation and titration were carried out and calculation was done.In this way nitrogen (% dry basis) is determined and finally protein content on seed is calculated by the formula
Protein(% dry basis): [Nitrogen (% dry basis) x 6.25)]
Statistical analysis
Cluster analysis
RESULTS AND DISCUSSIONS
|
S.N |
Genotype Name |
Hypocotyl color |
Leaflets Shape |
PubescenceDensity |
PubescenceColor |
Flower Color |
Seed coat color |
Hilum color |
Surface lusture |
Pht(cm) |
|
|
1 |
Cobb |
Green |
Intermediate |
Dense |
Brown |
White |
Yellow |
Brown |
Intermediate |
45.37 |
|
|
2 |
Hardee |
Green |
Intermediate |
Dense |
Brown |
White |
Yellow |
Brown |
Shiny |
57.8 |
|
|
3 |
AGS-376 |
Green |
Broad |
Dense |
Brown |
White |
Yellow |
Black |
Intermediate |
52.56 |
|
|
4 |
Puja |
Green |
Intermediate |
Normal |
Brown |
White |
Yellow |
Black |
Intermediate |
43.12 |
|
|
5 |
LS-77-16-16 |
Purple |
Narrow |
Normal |
Grey |
Purple |
Yellowish white |
Grey |
Intermediate |
26.79 |
|
|
6 |
Seti |
Green |
Intermediate |
Normal |
Brown |
White |
White |
Brown |
Intermediate |
41.85 |
|
|
7 |
Ransom |
Purple |
Intermediate |
Normal |
Brown |
Purple |
Yellow |
Black |
Intermediate |
40.54 |
|
|
8 |
Tarkari-Bhatmas-1 |
Purple |
Intermediate |
Normal |
Grey |
Purple |
Green |
Black |
Intermediate |
32.97 |
|
|
9 |
PK-7394 |
Purple |
Narrrow |
Sparse |
Brown |
Purple |
Yellowish white |
Brown |
Intermediate |
54.84 |
|
|
10 |
PK-327 |
Purple |
Intermediate |
Semi Sparse |
Grey |
Purple |
Yellowish white |
Grey |
Intermediate |
27.89 |
|
|
11 |
PI-94159 |
Green |
Intermediate |
Normal |
Brown |
White |
Yellow |
Brown |
Intermediate |
37.13 |
|
|
12 |
F-778817 |
Green |
Intermediate |
Semi Sparse |
Brown |
White |
Yellow |
Grey |
Intermediate |
35.25 |
|
|
13 |
IARS-87-1 |
Green |
Broad |
Semi Sparse |
Brown |
White |
Yellow |
Black |
Intermediate |
39.99 |
|
|
14 |
Iang-beakong |
Purple |
Intermediate |
Normal |
Brown |
Purple |
Yellow |
Brown |
Shiny |
57.05 |
|
|
15 |
TGX1485-1D |
Purple |
Intermediate |
Normal |
Grey |
White |
Yellow |
Grey |
Intermediate |
47.1 |
|
Table 2:Agro-morphological characteristics of 15 soybean accessions.
Agronomic Performances of Soybean Accession
|
Genotype |
DF |
DM |
Nodnm |
Pht(cm) |
Nodes |
Branch |
Pods |
Seeds |
TW |
SD(mm) |
GY |
Protein (%) |
|
Cobb |
42 |
125 |
48 |
45.37 |
11 |
4 |
30 |
1.93 |
143 |
5.12 |
1.72 |
39.73 |
|
Hardee |
45 |
126 |
53 |
57.8 |
13 |
5 |
59 |
1.9 |
123 |
4.87 |
2.9 |
41.13 |
|
AGS-376 |
43 |
127 |
55 |
52.56 |
10 |
5 |
54 |
2.03 |
133 |
4.86 |
2.8 |
40 |
|
Puja |
42 |
117 |
44 |
43.12 |
9 |
4 |
40 |
2 |
140 |
4.99 |
2.2 |
36.66 |
|
LS-77-16-16 |
40 |
100 |
45 |
26.79 |
9 |
4 |
44 |
2.26 |
100 |
4.39 |
1.76 |
41.93 |
|
Seti |
40 |
101 |
38 |
41.85 |
11 |
3 |
39 |
1.8 |
130 |
5.05 |
2.03 |
41.65 |
|
Ransom |
40 |
103 |
55 |
40.54 |
10 |
3 |
37 |
2.03 |
140 |
4.98 |
2.07 |
37.94 |
|
Tarkari-Bhatmas-1 |
40 |
94 |
42 |
32.97 |
9 |
2 |
35 |
1.96 |
153 |
5.17 |
2.15 |
35 |
|
PK-7394 |
50 |
110 |
50 |
54.84 |
12 |
3 |
70 |
1.96 |
113 |
4.76 |
3.17 |
43.17 |
|
PK-327 |
40 |
101 |
47 |
27.89 |
9 |
4 |
48 |
2.3 |
105 |
4.39 |
2.02 |
42.11 |
|
PI-94159 |
40 |
116 |
38 |
37.13 |
9 |
4 |
44 |
2.03 |
130 |
5.13 |
2.29 |
38.11 |
|
F-778817 |
43 |
117 |
47 |
35.25 |
9 |
4 |
42 |
2.16 |
153 |
5.1 |
2.58 |
35.93 |
|
IARS-87-1 |
43 |
117 |
40 |
39.99 |
11 |
4 |
49 |
2.23 |
157 |
5.38 |
3.07 |
39.65 |
|
Iang-beakong |
50 |
112 |
42 |
57.05 |
13 |
4 |
72 |
1.96 |
117 |
4.89 |
3.36 |
34.85 |
|
TGX1485-1D |
43 |
117 |
52 |
47.1 |
11 |
3 |
42 |
2.03 |
127 |
5.08 |
2.13 |
40.07 |
|
Mean |
42.73 |
112.24 |
46.37 |
42.68 |
10.46 |
3.69 |
46.95 |
2.04 |
130.89 |
4.94 |
2.42 |
39.19 |
|
P value |
0 |
0 |
0.89 |
0 |
0.0063 |
0.0995 |
0.01 |
0 |
0 |
0.001 |
0 |
0 |
|
F value |
7.13*1029 |
896.71 |
0.52 |
8.88 |
3.006 |
1.7563 |
2.74 |
4.1317 |
9.93 |
3.92 |
7.55 |
31.35 |
|
CV% |
1.60E-14 |
0.53 |
26.12 |
13.48 |
17.96 |
29.65 |
33.98 |
8.13 |
7.35 |
4.78 |
1.53E-14 |
2.1 |
|
LSD0.05 |
1.14E-14 |
0.99 |
20.26 |
9.62 |
3.14 |
1.83 |
26.69 |
0.27 |
16.1 |
0.39 |
6.17E-16 |
1.38 |
Correlation of different traits of soybean with protein content
|
Characters |
Nodnum |
GY(ton/ha) |
SD(cm) |
Test wt(gm) |
Protein(%) |
|
Nodnum |
1 |
0.030ns |
-0.155ns |
-0.023ns |
0.067ns |
|
GY(ton/ha) |
|
1 |
0.129ns |
0.023ns |
-0.117ns |
|
SD(cm) |
|
|
1 |
0.740** |
-0.35* |
|
Test wt (gm |
|
|
|
1 |
-0.479** |
|
Protein(%) |
|
|
|
|
1 |
According to previous finding correlation between seed protein content and grain yieldwas negative[13,18,20]. The negative correlation of protein content of seed with grain yield, seed diameter and test weight indicated that it would be very difficult to identify a soybean accession having higher grain yield simultaneously with higher protein content. Increase in one trait would result in reduction of the other, that is simultaneously increase or decrease of both traits would be difficult. Breeding for high seed protein concentration was based on increase in assimilates supply per seed. This increase however was more related with less seed set than more leaf area. This might be the link between high protein concentration and lower yield.
Nodule number was positively correlated with grain yield and protein content (Table 3).It might be due to nitrogen fixation process by the help of nodule present in roots of soybean plant. Due to the nitrogen fixation process, nitrogen content in the soil may increase and ultimately increase in yield also.
UPGMA clustering
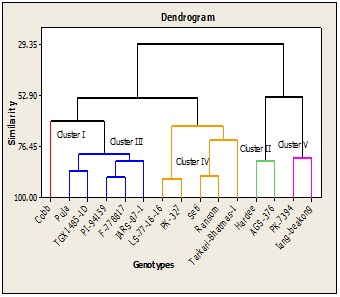
Cluster 1 consisted of one soybean accession i.e. Cobb. This cluster had lowest no of pods/plant and grain yield.Cluster 2 consisted of two soybean accession. It includes Hardee and AGS-376.This cluster contained late matured accession which had higher plant height and higher concentration of protein and relatively higher grain yield.Cluster 3 consisted of five soybean accessions. It include Puja, TGX1485-1D, PI-14159,F-778817 andIARS-87-1.These soybean accessions had intermediate value for days to flowering, days to maturity, plant height, no of pods/plant, grain yield and protein concentration.
Cluster 4 consisted of five soybean accessions. It include LS-77-16-16, PK-327, Seti, Ransom and Tarkari-Bhatmas-1.These were early matured accessions which had lowest plant height, no of fruiting nodes/plant and seed diameter. These accessions had intermediate value for protein concentration and grain yield. Cluster 5 consisted of two soybean accessions including PK-7394 and Iang beakong. These accessions had longer days to flowering, highest plant height, pods/plant, nodes/plant as well as grain yield among the accessions and intermediate value for the protein concentration.
CONCLUSION
ACKNOWLEDGEMENT
REFERENCES
- Berk Z (1992) Technology of production of edible flours and protein products from soybeans. FAO, Viale delle Terme di Caracalla, Rome, Italy.
- Kinsella JE (1979) Functional properties of soy proteins. Journal of the American Oil Chemists’ Society56: 242-258.
- Davies CGA, Netto FM, Glassenap N, Gallaher CM, Labuza TP, et al. (1998) Indication of the Maillard reaction during storage of protein isolates. Journal of Agricultural and Food Chemistry46: 2485-2489.
- Molina E, Defaye AB, Ledward DA (2002) Soy protein pressure-induced gels. Food Hydrocolloids16: 625-632.
- Aditya JP, Bhartiya P, Bhartiya A (2011) Genetic variability, heritability and character association for yield and component characters in soybean ( max (L.) Merrill). Journal of Central European Agriculture12: 27-34.
- Mulongoy K, Gueye M (1992) Biological nitrogen fixation and sustainability of tropical agriculture. John Wiley & Sons, New Jersey, USA.
- Oldroyd GE, Murray JD, Poole PS, Downie JA (2011) The rules of engagement in the legume-rhizobial symbiosis. Annu Rev Genet 45: 119-144.
- Harer PN, Deshmukh RB (1992) Genetic variability, correlation and path coefficient analysis in soybean (Glycine max.(L.) Merrill).Journal of Oilseeds Research 9: 65-65.
- Kayan N, Adak MS (2012) Associations of some characters with grain yield in chickpea (Cicerarietinum L.). Pakistan Journal of Botany44: 267-272.
- Malik MFA, Ashraf M, Qureshi AS, Khan MR (2011) Investigation and comparison of some morphological traits of the soybean populations using cluster analysis. Pakistan Journal of Botany43: 1249-1255.
- Thorne JC, Fehr WR (1970) Incorporation of High-Protein, Exotic Germplasm into Soybean Populations by 2- and 3-way Crosses. Crop Science10: 652-655.
- Brim CA, Burton JW (1979) Recurrent Selection in Soybeans. II. Selection for Increased Percent Protein in Seeds. Crop Science19: 494-498.
- Wehrmann VK, Fehr WR, Cianzio SR, Cavins JF (1987) Transfer of high seed protein to high-yielding soybean cultivars. Crop science27: 927-931.
- Wilcox JR, Cavins JF (1995) Backcrossing High Seed Protein to a Soybean Cultivar. Crop Science35: 1036-1041.
- Cober ER, D Voldeng H (2000) Developing high-protein, high-yield soybean populations and lines. Crop Science40: 39-42.
- Alt BJ, Fehr WR, Welke GA (2002) Selection for Large Seed and High Protein in Two- and Three-Parent Soybean Populations. Crop science42: 1876-1881.
- Wilcox JR, Guodong Z (1997) Relationships between Seed Yield and Seed Protein in Determinate and Indeterminate Soybean Populations. Crop Science37: 361-364.
- Wilcox JR, Shibles RM (2001) Interrelationships among Seed Quality Attributes in Soybean. Crop Science41: 11-14.
- Carter TE, Burton JW, Brim CA (1982) Recurrent Selection for Percent Protein in Soybean Seed — Indirect Effects on Plant N Accumulation and Distribution. Crop Science22: 513-519.
- Brim CA, Burton JW (1979) Recurrent Selection in Soybeans. II. Selection for Increased Percent Protein in Seeds. Crop Science19: 494-498.
Citation: Thapa P, Dhakal K H, Darai R, Shrestha A (2019) Seed Protein Diversity Assessment and Genetic Diversity among Different Soybean [Glycine max (L.) Merrill] Accession. J Agron Agri Sci 2: 009.
Copyright: © 2019 Thapa P, et al. This is an open-access article distributed under the terms of the Creative Commons Attribution License, which permits unrestricted use, distribution, and reproduction in any medium, provided the original author and source are credited.