Simplified Creatinine Index as a New Tool for Monitoring Protein Energy Malnutrition and Predict Outcome Risk in Hemodialysis Patients: Recent Findings and Perspectives
*Corresponding Author(s):
Bernard CanaudSenior Chief Scientist, Global Medical Office, Fresenius Medical Care Deutschland, Germany, Emeritus Professor, Montpellier University, School Of Medicine, Montpellier, France
Tel:+33 677735568,
Email:Bernard.Canaud@fmc-ag.com
Abstract
Simplified Creatinine Index (SCI) based on readily available parameters (i.e., patients’ demographics, single-pool Kt/V and pre-HD Serum Creatinine) has been developed. The predictive value of SCI as a marker of sarcopenia on patient outcomes was examined in a large international dataset (MONDO initiative) and recently reported. The SCI was shown to be a reliable and inexpensive marker of muscle metabolism. SCI was associated with age, gender and patient phenotype. SCI declined with ageing faster in male patients. In addition, SCI was strongly associated with HD patient outcomes and declines 5-7 months prior to death. Prognostic value of SCI compares with albumin, but with the advantage that its computation is typically collected monthly. SCI is a simple, easily obtainable, cost-effective and clinically relevant surrogate marker of muscle mass in HD patients that deserves to be closely monitored to detect early changes in nutritional and physical activity of HD patients.
Creatinine, As Abiochemical Compound With Dual Meaning In Human Being
In human beings, Creatinine (Cr) is an interesting biochemical compound produced in skeletal muscles and eliminated through the kidneys. More precisely, creatinine is a byproduct of skeletal muscle metabolism produced from creatine at a constant rate and clearedby kidneys mainly through glomerular filtration [1-3]. At any time, circulating concentration levels results fromthe creatinine generation rate over glomerular filtration rate ratio as shown in figure 1 [4]. Serum creatinine is part of laboratory biomarkers that are widely tested benefiting from precise international standards guidelines [5,6]. In clinical routine, SCr concentration is used to assess glomerular filtration rate and quantify kidney function level [7]. To this purpose, SCr is converted to an equivalent glomerular filtration rate using validated formulas integrating age, gender, ethnic and anthropometric data [8-11]. Chronic kidney disease may be thencharacterizedovertime byadecline in glomerular filtration rate and a proportional increase of SCr [12,13].
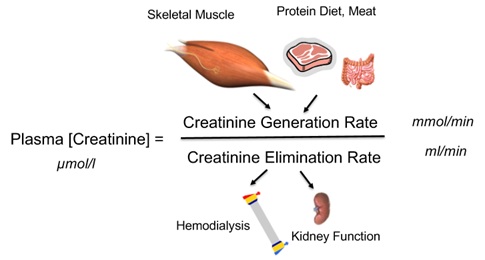 Figure 1: Plasma creatinine concentration as the ratio of creatinine generation rate over creatine elimination rate.
As complementary tool, creatinine mass balance (urinary excretion) or creatinine kinetic modeling (dialysis) may be used to calculate Creatinine Generation Rate (CGR) to estimate lean body mass and more precisely skeletal muscle mass turnover [4,14]. For that purpose, daily urinary creatinine mass output is requiredas constituting the main contributor to Creatinine Generation Rate (CGR). Contribution of gut metabolism and dietary protein intake (i.e., meat) to CGR may be then estimated from empirical equations [4]. In that perspective, CGR offers an easy and reliable biomarker for assessing individual’s muscle mass, nutritional status and physical activities in several clinical settings includes Chronic Kidney Disease (CKD) patients as shown in figure 2.
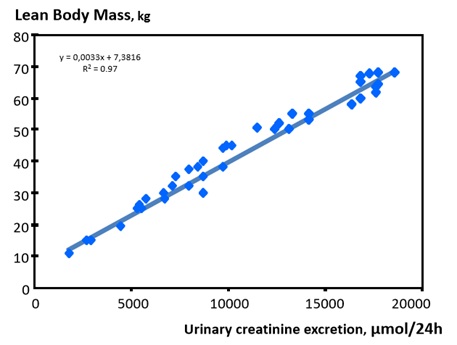 Figure 2: Correlation of lean body mass as function of urinary creatinine excretion.
Simplified Creatinine Index, A Simple Tool For Quantifying Skeletal Muscle Mass Changes In Dialysis Patients
In hemodialysis patients, the situation is more complex because urinary creatinine excretion has disappeared in most patients. SCr levels fluctuate according to the intermittent nature of dialysis treatment and are inversely related to dialysis efficacy [15,16]. Regardless of these limitations, higher predialysis SCr levels have been associated with a reduced risk of mortality, clearly indicating its predominant role as a nutritional marker in dialysis patients. Several Creatinine Kinetic Models (CKMs) have been developed to calculate the creatinine appearance rate from which the creatinine index (expressed in units of mg/kg/day) was deducedand further used to estimate the lean body mass (in kg) [15-17]. However, CKM requires measurements of postdialysis SCr and rather complex mathematical algorithms. To solve these issues, a simplified creatinine index (SCI) based on readily available parameters patients’ demographics, single-pool Kt/V and predialysis SCr was developed [18]. Rationale of SCI development is presented in figure 3. Several recent retrospective and prospective cohort studies demonstrated a high predictive value of SCI on HD patient outcomes [19,20].
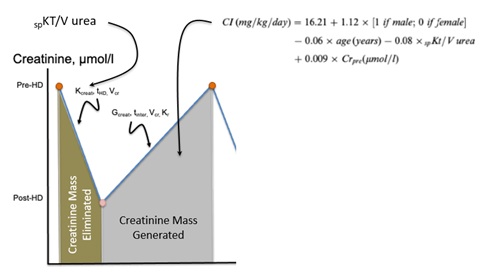 Figure 3: Rationable of the simplified creatinine index formula.
Outlining Main Features and Findings of the MONDO Study
In the current referred work, we assessed the reliability and reproducibility of the Simplified Creatinine Index (SCI) in a large population-based study, as a surrogate marker of Muscle Mass (MM) and explored its association with hemodialysis patient’s phenotype, dynamics before death and predictive value on outcome [21]. In addition, we compared estimated Lean Tissue Index (LTI) from SCI to that one measured by Multifrequency Bioimpedance (MF-BIA).
The complete data set of the international MONDO initiative consortium was used for the analysis. All in-centre HD patients from 16 European countries with at least one SCI. We included 23495 hemodialysis patients from which 3662 were incident. The baseline period was defined as 30 days before and after the first multi frequency Bioimpedance Spectroscopy (MF-BCM) measurement and the subsequent 7years constituted the follow-up. SCI was calculated by the previously reported equation [18]. Multivariate Cox proportional hazards models were applied to assess the association of SCI with all-cause mortality. Using backward analysis, we explored the trends of SCI before death. Bland-Altman analysis was performed to analyze the agreement between estimated from SCI and measured lean tissue index from MF-BCM. Spline analyses were also used to assess the impact of lean tissue mass changes either from estimated (SCI) or measured (MF-BCM) on patient outcomes.
Schematically, the Main Findings were as Follows
- • Across all age strata SCI were higher in males than females. The highest SCI was observed in males 18-29 years of age. In both sexes, SCI levels decreased with age, with the lowest SCI in patients >80 years of age.
- • Higher SCI was associated with a lower risk of mortality [unadjusted hazard ratio 0.81 (95% confidence interval 0.79-0.82); adjusted HR 0.90 (95% CI 0.86-0.93)]. In addition, BMI [unadjusted HR 0.97 (95% CI 0.96-0.98); adjusted HR 0.98 (95% CI 0.97-0.99)] and serum albumin [unadjusted HR 0.30 (95% CI 0.28-0.33); adjusted HR 0.49 (95% CI 0.44-0.55)] were associated with lower risk of all-cause mortality.
- • SCI decline accelerated ≈5-7 months before death and was more pronounced in males. Similar observations were seen in patients with vintages <12 and >18 months, with normohydrated and overhydrated status.
- • Lean Tissue Index (LTI) estimated by SCI was correlated with measured LTI in both sexes (males: R2 1⁄4 0.94; females: R2 1⁄4 0.92; both P<0.001). Bland-Altman analysis showed that measured LTI was 71kg/m2 (±2 SD: -12.54-3.13) lower than estimated LTI.
- • Cubic spline analyses showed that higher SCI (>20.5mg/kg/day), measured LTI (>12.8kg/m2) and estimated LTI (>16.1kg/m2) values were associated with lower risk of mortality in the unadjusted and adjusted models.
Our study developed in a large international population showed that SCI is strongly associated with clinically relevant outcomes.SCI tends to be higher in male and younger HD dialysis patients. We also observed that a higher SCI was associated with a survival benefit in both males and females. In patients who died, SCI declined months before death in both male and female patients.
From the current study, we observed that LTI derived from SCI and MF-BIS were strongly related, the former tended to generally overestimate LTI as compared with the measured method.
Considering SCI differences noted in patients between 18 and 29 years and >80 years of age, one can estimate an active muscle mass decrease of ~27% in males and ~26% in females. This value exceeds by about the 20% decrease in active muscle mass reported in a healthy sex- and age-matched population [4]. In addition, the lower SCI observed in older patients supports the notion that muscle mass is much lower in HD patients compared with a healthy, age-matched population. The decrease in SCI most likely shows a loss of ‘active’muscle mass and a slowdown of muscle metabolism turnover, indicating poor physical performance, low appetite and high prevalence of inflammation, particularly in older dialysis patients.
The rapid decline of SCI ≈6 months before death suggests that muscle wasting is triggered by catabolic factors and accelerated ageing processes noted in uremia and, possibly, precipitated by reduced physical activity, diet protein and caloric intake, muscle synthesis and deconditioning. The finding supports the hypothesis that SCI can be viewed as a skeletal muscle nutritional surrogate in dialysis patients providing to clinicians a useful indicator of malnutrition.
Conclusion and Perspectives
Considering the relatively high prevalence [22,23] and the poor outcome associated with protein energy malnutrition in dialysis patients, it is of upmost importance to detect and work on this high-risk condition as earlier as possible [24,25]. In this context, most of markers, including serum albumin, tend to decline or worsen relatively late, taking several weeks before being reduced, in the course of disease [26-29]. Therefore, we suggest that monthly monitoring of SCI, as part of routine baseline dialysis patient monitoring, will offer a new and cost-effective tool to detect earlier nutritional status deterioration. SCI used as a surrogate marker of active MM would facilitate in that cases detection of sarcopenia trends, offering opportunities to implement interventions that might delay, and halt or even reverse such deleterious dynamics.
To that end, SCI can be easily integrated and used as a first line tool in complement to visceral proteins (i.e., albumin) to monitor muscle mass changes in clinical routine. More cumbersome or costly methods aiming to assess more precisely body composition (LBM/FTM) based on Bioimpedance (BIA) [30], imaging techniques [31-33], quantization of muscle strength [34] or physical activity [35], would be considered then as a second line of nutritional tool assessment.
References
- Wyss M, Kaddurah-Daouk R (2000) Creatine and creatinine metabolism. Physiol Rev 80: 1107-1213.
- Dalton RN (2010) Serum creatinine and glomerular filtration rate: Perception and reality. Clin Chem 56: 687-689.
- Shemesh O, Golbetz H, Kriss JP, Myers BD (1985) Limitations of creatinine as a filtration marker in glomerulopathic patients. Kidney Int 28: 830-838.
- Forbes GB (2012) Human Body Composition: Growth, Aging, Nutrition, and Activity. Springer-Verlag, New York, USA.
- Schmidt RL, Straseski JA, Raphael KL, Adams AH, Lehman CM (2015) A risk assessment of the Jaffe vs. Enzymatic method for creatinine measurement in an outpatient population. PLoS One 10: 0143205.
- Küme T, Saglam B, Ergon C, Sisman AR (2018) Evaluation and comparison of Abbott Jaffe and enzymatic creatinine methods: Could the old method meet the new requirements? J Clin Lab Anal 32: 22168.
- Cockcroft DW, Gault MH (1976) Prediction of creatinine clearance from serum creatinine. Nephron 16: 31-41.
- Agarwal R (2005) Estimating GFR from serum creatinine concentration: Pitfalls of GFR-estimating equations. Am J Kidney Dis 45: 610-613.
- Levey AS (1990) Measurement of renal function in chronic renal disease. Kidney Int 38: 167-184.
- Levey AS, Bosch JP, Lewis JB, Greene T, Rogers N, et al. (1999) A more accurate method to estimate glomerular filtration rate from serum creatinine: A new prediction equation. Modification of Diet in Renal Disease Study Group. Ann Intern Med 130: 461-470.
- Levey AS, Perrone RD, Madias NE (1988) Serum creatinine and renal function. Annu Rev Med 39: 465-490.
- Levey AS, Atkins R, Coresh J, Cohen EP, Collins AJ, et al. (2007) Chronic kidney disease as a global public health problem: Approaches and initiatives-a position statement from kidney disease improving global outcomes. Kidney Int 72: 247-259.
- Levey AS, Eckardt KU, Tsukamoto Y, Levin A, Coresh J, et al. (2005) Definition and classification of chronic kidney disease: A position statement from Kidney Disease: Improving Global Outcomes (KDIGO). Kidney Int 67: 2089-2100.
- Forbes GB, Bruining GJ (1976) Urinary creatinine excretion and lean body mass. Am J Clin Nutr 29: 1359-1366.
- Canaud B, Garred LJ, Argiles A, Flavier JL, Bouloux C, et al. (1995) Creatinine kinetic modelling: A simple and reliable tool for the assessment of protein nutritional status in haemodialysis patients. Nephrol Dial Transplant 10: 1405-1410.
- Keshaviah PR, Nolph KD, Moore HL, Prowant B, Emerson PF, et al. (1994) Lean body mass estimation by creatinine kinetics. J Am Soc Nephrol 4: 1475-1485.
- Desmeules S, Lévesque R, Jaussent I, Leray-Moragues H, Chalabi L, et al. (2004) Creatinine index and lean body mass are excellent predictors of long-term survival in haemodiafiltration patients. Nephrol Dial Transplant 19: 1182-1189.
- Canaud B, Vallee AG, Molinari N, Chenine L, Leray-Moragues H, et al. (2014) Creatinine index as a surrogate of lean body mass derived from urea Kt/V, pre-dialysis serum levels and anthropometric characteristics of haemodialysis patients. PLoS One 9: 93286.
- Suzuki Y, Matsuzawa R, Kamiya K, Hoshi K, Harada M, et al. (2020) Trajectory of lean body mass assessed using the modified creatinine index and mortality in hemodialysis patients. Am J Kidney Dis 75: 195-203.
- Yamada S, Taniguchi M, Tokumoto M, Yoshitomi R, Yoshida H, et al. (2017) Modified creatinine index and the risk of bone fracture in patients undergoing hemodialysis: The Q-Cohort Study. Am J Kidney Dis 70: 270-280.
- Canaud B, Ye X, Usvyat L, Kooman J, van der Sande F, et al. (2020) Clinical and predictive value of simplified creatinine index used as muscle mass surrogate in end-stage kidney disease haemodialysis patients-results from the international MONitoring Dialysis Outcome initiative. Nephrol Dial Transplant 35: 2161-2171.
- Sahathevan S, Khor BH, Ng HM, Gafor AHA, Mat Daud ZA, et al. (2020) Understanding development of malnutrition in hemodialysis patients: A narrative review. Nutrients 12: 3147.
- Zha Y, Qian Q (2017) Protein nutrition and malnutrition in CKD and ESRD. Nutrients 9: 208.
- Marcelli D, Usvyat LA, Kotanko P, Bayh I, Canaud B, et al. (2015) Body composition and survival in dialysis patients: Results from an international cohort study. Clin J Am Soc Nephrol 10: 1192-1200.
- Fouque D, Kalantar-Zadeh K, Kopple J, Cano N, Chauveau P, et al. (2008) A proposed nomenclature and diagnostic criteria for protein-energy wasting in acute and chronic kidney disease. Kidney Int 73: 391-398.
- Keller U (2019) Nutritional laboratory markers in malnutrition. J Clin Med 8: 775.
- Cano NJ (2002) Metabolism and clinical interest of serum transthyretin (prealbumin) in dialysis patients. Clin Chem Lab Med 40: 1313-1319.
- Dalrymple LS, Johansen KL, Chertow GM, Grimes B, Anand S, et al. (2013) Longitudinal measures of serum albumin and prealbumin concentrations in incident dialysis patients: The comprehensive dialysis study. J Ren Nutr 23: 91-97.
- Friedman AN, Fadem SZ (2010) Reassessment of albumin as a nutritional marker in kidney disease. J Am Soc Nephrol 21: 223-230.
- Marcelli D, Wabel P, Wieskotten S, Ciotola A, Grassmann A, et al. (2015) Physical methods for evaluating the nutrition status of hemodialysis patients. J Nephrol 28: 523-530.
- Zhou Y, Hoglund P, Clyne N (2019) Comparison of DEXA and bioimpedance for body composition measurements in nondialysis patients with CKD. J Ren Nutr 29: 33-38.
- Sabatino A, D'Alessandro C, Regolisti G, di Mario F, Guglielmi G, et al. (2020) Muscle mass assessment in renal disease: The role of imaging techniques. Quant Imaging Med Surg 10: 1672-1686.
- Nielsen PK, Ladefoged J, Olgaard K (1994) Lean body mass by Dual Energy X-ray Absorptiometry (DEXA) and by urine and dialysate creatinine recovery in CAPD and pre-dialysis patients compared to normal subjects. Adv Perit Dial 10: 99-103.
- Keller K, Engelhardt M (2013) Strength and muscle mass loss with aging process. Age and strength loss. Muscles Ligaments Tendons J 3: 346-350.
- Matsuzawa R, Roshanravan B, Shimoda T, Mamorita N, Yoneki K, et al. (2018) Physical activity dose for hemodialysis patients: Where to begin? Results from a prospective cohort study. J Ren Nutr 28: 45-53.
Citation: Canaud B (2021) Simplified Creatinine Index as a New Tool for Monitoring Protein Energy Malnutrition and Predict Outcome Risk in Hemodialysis Patients: Recent Findings and Perspectives. J Nephrol Renal Ther 7: 050.
Copyright: © 2021 Bernard Canaud, et al. This is an open-access article distributed under the terms of the Creative Commons Attribution License, which permits unrestricted use, distribution, and reproduction in any medium, provided the original author and source are credited.