Thermal Maturity of the Organic Matters and Kerogen Types in the Late Miocene Zeit Formation, Red Sea Basin, Eastern Sudan
*Corresponding Author(s):
Sadam H.M.A EltayibOmdurman Islamic University, Department Of Geology Faculty Of Science And Technology-Omdurman, Khartoum, Sudan
Email:sadam_h3@yahoo.com
Abstract
The pyrolysis data was used to determine the source rock quality and quantity as organic richness, source rock generating capability and kerogen types of the source rock in the Late Miocene Zeit Formation, Red Sea Basin, Eastern Sudan. The vitrinite reflectance measurements (Ro %) of some selected samples, which are the most powerful paleogeothermometer maturity indicator are used to detect the thermal maturity level of source rocks. The study provided also the relationship between pyrolysis Hydrogen Index (HI) and peak temperature of pyrolysis (Tmax) of source rock in the study area which shows that the organic type in the four horizons are mainly of Type III. Based on the analysis of the relationship between HI and Total Organic Carbon TOC, it is noted that the HI of most of the samples which show Type II has a relation with the higher content of TOC, so in general the organic type is mainly Type III. The relationship between pyrolysis Hydrogen Index (HI) and peak temperature of pyrolysis (Tmax) of source rocks shows that the organic type in the four horizons are mainly type III. Based on the relationship between HI and TOC, it is obvious that the HI of most of the samples of type II2 has a relation with the higher content of TOC. In general, the organic type of samples belongs to Type III. The relation between Ro values and depth of samples shows that the roof of the oil generating window lies at depth 1750m while that of the gas window is at depth 3550m. The floor of the gas window lies at depth 4500m deeper than 4500m. The organic matter will arrive to over maturity stage. Many samples in well SS-1W at shallow depths show higher Ro than deeper ones, which may be due to the tectonic uplift. In addition, pyrolysis Tmax values of analyzed samples reflect mature to immature stage for the studied rocks. In general, Tmax maturity pattern differs slightly than that given by the Ro values.
Keywords
Kerogen; Maturity; Pyrolysis; Zeit Formation
Introduction
The study area lies in NE Sudan in the Red Sea State. It is bounded by longitudes 37o 30′ E & 38o 15′ E and latitudes 19o 00′ N & 22o 00′ N The main physiographic features in the study area are part of Red Sea Hills in the west and coastal plain in the east. The Sudanese coastal plain is 740 km long, generally 20 km wide but increasing to 40 km at Halaib area on its northern edge and to 50 km at Tokar Delta in the south. It lies between the Red Sea and the erosional scarp that bounds the Red Sea Hills from the east. The coastal plain is predominantly made of interdigitating marine and continental deposits of Pleistocene and recent age, including raised coralline limestone near the shoreline and thick, very coarse, angular terrace deposits near the foot of the Red Sea Hills. These sediments overlie unconformably the Tertiary deposits of the Red Sea littoral [1]. The main features of the coastal plain north of Port Sudan are the presence of several isolated outcrops of clastic and carbonate deposits; these include the Low Conical Hills, Eit outcrops, Jebel Saghum, Jebel Tobanam and Jebel Hmamit. These coastal hills are formed almost entirely of carbonate, gypsum and clastic deposits with a height of over 100 m and they extend north - south. The southern extension of the Low Conical Hills trend in a curve – shape nearly to the eastern escarpment of the Red Sea Hills. The width of the coastal plain in the study area is about 16 km. It is generally flat to gently sloping towards the Red Sea, interrupted by scattered sedimentary outcrops and ridges consisting of continental and marine sediments. The study area is covered mainly by recent deposits, characterized in the north-eastern portion of the area mainly by sand dunes, alluvial terraces and sabkha deposits near the Red Sea shoreline. The eastern and northern parts of the area are flat and covered by gravel terraces of basic and acidic origin, except in the main course of Khor Eit, where the sediments are smaller in size. The Red Sea is a long narrow marine basin, with a total length in Sudan of about 740 km. It extends from the Eritrean border in the south to the border with Egypt in the north. Its maximum width is 306 km. The Red Sea is the eastern boundary of the study area, with a width of about 148 km in the study area. The offshore part of the delta is approximately 150 km long and 55 km wide limited by the 1000’ isobath contour. The offshore part can be subdivided into a shelf area covered mostly by the offshore part of the Tokar Delta and a prominent shelf break going to the deep water eastward. The water depth of the shelf is varying from very shallow water with reefs, pierced reefal islands to approx. 300m depth. The deep water east and north of the shelf could reach to a depth of about 2000m. The eastern limits of the block are very close to the western periphery of the Red Sea axial trough [2].
General Stratigraphy
The main stratigraphic sequences are briefly described as follows from top to bottom [3]:
Shagara Formation: Shagara Formation is represented by mixed lithotypes consisting of marine sand/sandstone section intercalated with claystone, partly with thin streaks of dolomite, anhydrite and limestone.
Wardan Formation: It is dominated by sandstones and shales with siltstone, thin carbonate interbeds, and evaporite streaks.
Zeit Formation: Top of the Zeit Formation is defined based on the first thick anhydrite bed. It is represented mainly by rapid intercalations between clastics (shale and sandstone) and evaporites (salt and anhydrite), that were deposited under lagoonal, deltaic environment with intermittent continental influence.
Dungunab Formation: It is composed of a very thick sequence of evaporites (rock salt and anhydrite) with thin beds of shales.
Belayim Formation: The Belayim Formation is represented by sandstone and shale at the top and two main anhydrite beds at the bottom separated by shale interbeds.
Kareem Formation: It is represented by sandstone and shale with a thickness of about 542m. The section unconformably overlies metamorphic Basement rocks.
Basement: The igneous rocks are mainly undeformed but metamorphosed intermediate to basic igneous rocks (lower ampibolite facies).
Objectives
The main objectives of this study are:
- Investigate the geochemical, geothermal subsidence history of the sedimentary cover in order to estimate the level of maturity reached by source rock in undrilled trough areas, guided by measured and calculated maturity indicators.
- Developing and measuring the maturity history of source rocks in the area.
- Investigate the geochemical, geothermal subsidence history of the sedimentary cover in order to estimate the level of maturity reached by source rock in undrilled trough areas, guided by measured and calculated maturity indicators.
- Delineate the mature areas (hydrocarbon kitchens) within the study areas.
Materials and Methods
- The thermal maturity of the organic matter in shales of Zeit Formation source rock is determined in this study using the vitrinite reflectance Ro (%) and the pyrolysis results HI and Tmax cited in the previous studies on the area.
- In this study the geochemical models are followed to evaluate the maturity of Zeit Formation.
- A set of 10 wells is modeled for constructing the maturity profiles.
- Geothermal gradient values were calculated for the 10 drilled wells using the recorded Bottom Hole Temperature (BHT) and from which the geothermal gradient of the constructed pseudo-wells in the North Suakin, East Tokar and East Bashayer deep troughs were estimated.
Results And Discussion
Level of Thermal Maturation
Kerogen is subjected to physical and chemical changes due to increasing temperatures and pressures as the depth of burial increase. The result of these changes is the generation of hydrocarbons. Maturation can be defined as the physicochemical transformation of OM during the burial history of source rocks in sedimentary basins. Maturation of OM in a source rock is controlled by biological activity in an early stage, then physical and chemical effects due to elevated temperatures and pressures. Thus, maturity is a product of the combined effect of elevated temperature due to progressive depth of burial and geologic age of rocks. Therefore, any source rock may not be qualified as an effective hydrocarbons generator before it maintains sufficient thermal maturation. Therefore, determination of thermal maturation of any source rock is an essential requisite to evaluate its efficiency for generating hydrocarbons. Source rocks can be divided thermally into three types:
- Immature source rock, which has not yet generated hydrocarbons.
- Mature source rock, which has generated both oil and/or gas.
- Over mature source rock, which has generated dry gas.
Thermal Maturity of the Organic Matter
Vitrinite reflectance measurements (Ro, wt. %) of shales of Zeit Formation range from 0.90 to 1.35% in well S. Suakin-1 indicating mature organic matter at the depth value 9000 ft down to 12500 ft (Table 1) (Fig. 1). Also Ro % ranges from 0.60 to 1.65% in well SU-2W (Figure 2), and from 0.62 to 0.85% in well TO-1W denoting mature organic matter. The calculated average values of Ro (%) indicate 1.09, 0.73, 0.7, 0.6 and 1.83% for wells SU-2W (Figure 2), TO-1W, BA-1W, BA-2W and SS-1W (Figure 1), respectively these values and averages of Ro indicate fair thermal maturity to mature organic matter since the values are covering the range from about 0.5% (immature) to about 1.88%. The Ro pattern shows that, Zeit Formation in the eastern (offshore) and the western (near shore) areas are still immature as its shale rocks have not yet reached the early generation zone (Ro, < 0.5%). Zeit Formation shales reached the oil-window zone at the depocentral area of the East BA-1W trough and the periphery areas of the North SU-2W and East TO-1W troughs. Furthermore, the formation has reached the gas-window in the depocentral areas of the North. In the other areas of study area, Zeit Formation most likely, has reached the early generation zone. This study discussed the relation between Ro values and depth of samples, concluded that the roof of the oil-generating window lies at depth 1750m while that of the gas window is at depth 3550m. The floor of the gas window lies at depth 4500m deeper than 4500m, the organic matter will arrive to over maturity stage However, many samples in SS-1W at shallow depths show higher Ro than deeper ones, which may be due to the tectonic uplift (Figure 1). The pyrolysis Tmax values of analyzed samples reflect mature to immature stage for the studied rocks in wells BA-2W, SS-1W and SU-1W (Figures 3-5). In general, Tmax maturity pattern differs slightly than that given by the Ro values concerning the depth to the roof of oil window in the wells. (Figures 5 and 6) denote the relationship between the hydrogen index (HI) and the Tmax of samples from different wells in the area. The diagram confirms the predominance of Type III kerogen and also indicates the wide thermal maturity range of the studied samples from immature to mature (oil window). Furthermore, (Figure 6) also shows the relationship between Tmax values and depth indicating different depths for the roof of oil window in the studied wells.
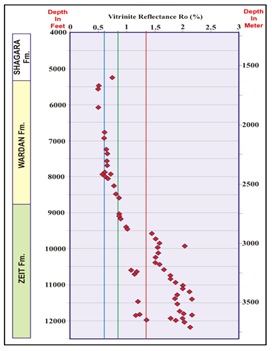 Figure 1: Relationship between Vitrinite reflectances (Ro,%) and depth, well SS-1W.
 Figure 2: Relationship between Vitrinite reflectances (Ro,%) and depth, well SU-2W.
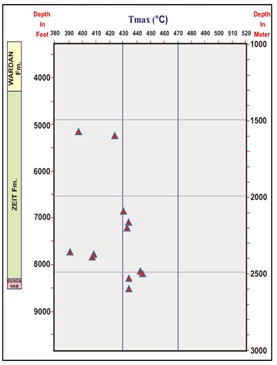 Figure 3: Relationship of Maximum Temperature (Tmax) values with depth of shales In Wardan and Zeit formations, well BA-1W
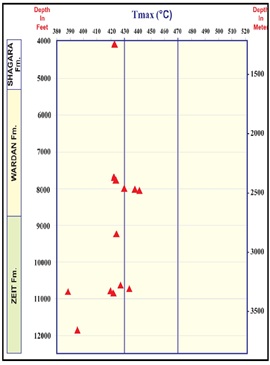 Figure 4: Relationship of Maximum Temperature (Tmax) values with depth of shales in Wardan and Zeit formations, well SS-1W.
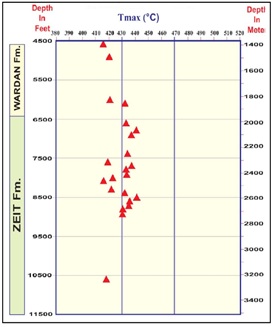 Figure 5: Relationship of Maximum Temperature (Tmax) values with depth of Shales in Wardan and Zeit formations, well SU-2W.
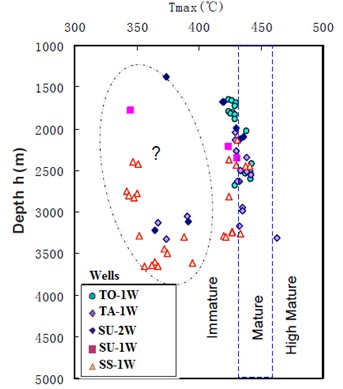 Figure 6: Tmax vs Depth of studied wells in study area.
Maturity Modeling
Methods of modeling of basin maturation has been outlined by many investigators. The most particular are [4-9]. In this study the geochemical models suggested by those authors are followed to evaluate the maturity of Zeit Formation. Accordingly, the oil window, in this work, is defined as an imaginary zone enclosed between 0.8 Ro% as a top or roof of the zone of peak generation and expulsion and 1.35 Ro% as the base or floor of the zone. the gas generation zone begins below this zone. A set of 10 wells is modeled for constructing the maturity profiles. Furthermore, three maturity profiles representing three pseudo-wells in the troughs were also constructed. The total number of wells which have measured vitrinite reflectance values is 5 wells only. This number is considered small for evaluating the maturity levels of study area. Therefore, in order to precisely evaluate the entire study area, the data of all the drilled wells must be used. This is achieved by considering the calibrated measured Ro % values of the 4 wells. Though, the models of the rest of wells are based on Geothermal Gradients from calibrated Ro %, although maturity profiles of these wells have no measured Ro % (Table 1).
|
Well Code |
Depth(m) |
BHF( F o )*1.075 |
Corr. BHF( F o ) |
G.Gradient(C o /100m) |
Calibrated G.G |
|
SS-1W |
3505 |
370-400 |
413.9 |
5.281 |
2.3 Ro% |
|
SU-1W |
3657 |
340-370 |
381.6 |
4.571 |
1.30 Ro% |
|
SU-2W |
3243 |
357 |
384 |
5.208 |
2.87 Ro% |
|
BA-1W |
2789 |
310 |
333.3 |
5.044 |
2.77 |
|
BA-2W |
2700 |
290 |
311.8 |
4.771 |
2.62 |
|
DU-1W |
2825 |
268 |
288 |
4.097 |
2.25 |
|
DI-1W |
2201 |
190 |
204 |
4.553 |
2.50 |
|
DU-2W |
- |
- |
- |
4.006 |
2.20 |
|
TA-1W |
1640 |
188 |
202 |
4.134 |
2.20 Ro% |
|
TO-1W |
2652 |
270-290 |
312 |
4.844 |
2.70 Ro% |
Table 1: Data of the BHT and geothermal gradients of the studied wells.
Geothermal Gradient
The geothermal gradients were used of the wells which have BHTs or measured vitrinite reflectance to enable modeling their thermal burial histories. The GG values and the measured vitrinite reflectance, which can be considered as paleogeothermometers, were used for calibrating and matching the thermal and the tectonic histories of the drilled wells in order to obtain a realistic and reliable thermal history of the sedimentary section in such troughs. Geothermal gradient values were calculated for the 10 drilled wells using the recorded Bottom Hole Temperature (BHT) and from which the geothermal gradient of the constructed pseudo-wells in the North SU-1W, East TO-1W and East BA-1W deep troughs were estimated.
The geothermal gradient (GG) was calculated using the following equation:
GG = (Corrected BHT - Annual Surface Temperature) / Depth of that BHT in (Ft) x 100
The GG is expressed in degree Fahrenheit (°F) per 100 ft. Table 1 shows the BHTs of the drilled wells in study area and the correction factor used in corrections and geothermal gradient. The calibrated geothermal gradients used for the wells have measured vitrinite reflectance also plotted. The maximum GG recorded in SS-1W well is 2.9 (52.78 °C/Km), while the minimum GG is recorded in the DI-1W well 1.71 °F/100 (31.12 °C/Km). The applied predicted geothermal gradient for the SS-1W, East TO-1W and East BA-1W are 2.6, 2.5 and 2.55 °F/100 (47.32, 45.5 and 46.41 °C/Km) respectively, from the nearby wells.
Conclusion
- The geochemical information and data acquired by exploration activities on study area have been reviewed for evaluating the source rock and their hydrocarbons generation potential.
- The geochemical analysis included Rock-Eval Pyrolysis, Kerogen isolation and maceral determination, Ro determination, carbon isotope and elemental analysis.
- Discussed the organic matter type of source rock based on Rock-Eval results (Hydrogen Index), Element Analysis, Kerogen analysis (Carbon Isotope and Microscopic Examination Index) parameters.
- Twenty five (25) samples were analyzed belonging to Lower Zeit (Dungunab) (three samples) and Zeit Formation (twenty two). The obtained stable carbon isotope values (δ13C) of kerogen ranges from -27.1% to -16.2% with a mean value of -21.3% denoting the kerogen type II as the dominant type.
- Based on horizon statistics, the kerogen stable carbon isotopic value in the source rock of Zeit Formation is between -27.1% and -16.2% with a mean value of -20.75% and the dominant organic type is Type III. The kerogen stable carbon isotopic value in the source rock of Lower Zeit (Dungunab Formation) is between -25.8% and -24.7% with an average of -25.1% and the main organic type is also Type III.
- The maturity of organic matter in source rocks is determined in the study using the vitrinite reflectance Ro (%),Tmax , CPI and OEP parameters.
- Isomerization parameters of sterane and hopane of saturated hydrocarbon of soluble organic matter are used also when they are available to show the maturity levels.
- The dominant kerogene type of Zeit Formation is the gas-prone Type III of terrestrial origin, particularly in the western near shore region of East BA-1W –South SU-1W troughs. It might be the source for dry gas in BA-1W well.
References
- Whiteman AJ (1971) The geology of the Sudan Republic. Clarendon Press, Oxford, 290.
- Eltayib SHMA, Al-Imam OAO, Abdelrahman EM, Ibrahim, ASM (2018) Subsurface Structural Mapping and Hydrocarbon Potentiality Using Seismic Data in Sudanese Red Sea Coastal Plain, Africa Journal of Geosciences 1.
- Carella R, Scarpa N (1962) Geological results of exploration in Sudan by Agip Mineraria. Proceedings of the 41h Arab Petroleum Congress, Beirut 27 (B3), 23.
- Tissot BP, Welte DH (1978) Petroleum formation and occurrence: A new approach to oil and gas exploration. Springer–Verlag, 429-449.
- Tissot BP, Welte DH (1984) Petroleum Formation and occurrence. 2nd ed.Heidelberg. Springer–Verlag, 699.
- Waples DW, Kamata H, Suizu M (1992) The art of maturity modelling, part 1: Finding a satisfactory geologic model. AAPG Bull., 76: 47-66.
- Waples DW, Suizu M, Kamata H (1992) The art of maturity modelling, part 2: Alternative models and sensitivity analysis. AAPG Bull., 76: 47–66.
- Hunt JM (1996) Petroleum Geochemistry and geology Freeman WH and Company, New York, 2nd edition, 743.
- Hunt JM (1979) Petroleum geochemistry and geology. Freeman, San Francisco, 617.
Citation: Eltayib SHMA (2023) Thermal Maturity of the Organic Matters and Kerogen Types in the Late Miocene Zeit Formation, Red Sea Basin, Eastern Sudan. J Atmos Earth Sci 7: 031.
Copyright: © 2023 Sadam H.M.A Eltayib, et al. This is an open-access article distributed under the terms of the Creative Commons Attribution License, which permits unrestricted use, distribution, and reproduction in any medium, provided the original author and source are credited.